Growth retardation and premature aging phenotypes in mice with disruption of the SNF2-like gene, PASG - PubMed (original) (raw)
. 2004 May 1;18(9):1035-46.
doi: 10.1101/gad.1176104. Epub 2004 Apr 22.
Affiliations
- PMID: 15105378
- PMCID: PMC406293
- DOI: 10.1101/gad.1176104
Growth retardation and premature aging phenotypes in mice with disruption of the SNF2-like gene, PASG
Lin-Quan Sun et al. Genes Dev. 2004.
Abstract
Imperfect maintenance of genome integrity has been postulated to be an important cause of aging. Here we provide support for this hypothesis by demonstrating that the disruption of PASG (lsh), a SNF2-like factor that facilitates DNA methylation, causes global hypomethylation, developmental growth retardation and a premature aging phenotype. PASG mutant mice display signs of growth retardation and premature aging, including low birth weight, failure to thrive, graying and loss of hair, reduced skin fat deposition, osteoporosis, kyphosis, cachexia, and premature death. Fibroblasts derived from PASG mutant embryos show a replicative senescence phenotype. Both PASG mutant mice and fibroblasts demonstrate a markedly increased expression of senescence-associated tumor suppressor genes, such as p16(INK4a), that is independent of promoter methylation, but, instead, is associated with down-regulation of bmi-1, a negative regulator of p16(INK4a). These studies show that PASG is essential for properly maintaining DNA methylation and gene expression patterns that are required for normal growth and longevity. PASG mutant mice provide a useful model for the study of aging as well as the mechanisms regulating epigenetic patterning during development and postnatal life.
Figures
Figure 1.
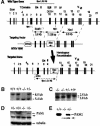
Targeted disruption of PASG by homologous recombination. (A) Genomic map of the targeting vector and predicted wild-type and disrupted alleles. The black boxes with numbers above them represent the 21 PASG exons. Roman numbers indicate the putative seven-helicase domains with domain I containing the ATP-binding site and domain II containing the DExH box. Probe indicates the 5′ genomic probe external to the targeted region used for Southern blot analysis. (B) Southern blot analysis shows the expected targeted disruption of the PASG gene. Genomic DNA was digested with SpeI and hybridized with 5′ genomic probe. The 8.5-kb fragment indicates the wild-type allele and a 5.4-kb fragment represents the mutant allele. (C) Northern blot analysis of the mRNA purified from E14.5 embryos shows a short form of the PASG transcript (2.0 kb) in heterozygous and homozygous mice. The probe is a 1.0-kb cDNA fragment from the C terminus of PASG ORF. (D) Western analysis of PASG protein shows that the truncated PASG protein is not detected in PASG-/- animals and PASG+/-. The arrow indicates the position of predicted short form of PASG. Nuclear extracts from MEFs were electrophoretically separated, transferred for Western blotting, and exposed to a rabbit antiserum raised against a selected peptide in the C-terminal region of PASG as described in Materials and Methods. The molecular mass of the wild-type and predicted short form of PASG is 95.2 kD and 77.4 kD, respectively. (E) Immunoprecipitation of PASG followed by Western blot analysis showed a low level of truncated PASG protein was expressed in PASG-/- and PASG+/- MEFs. The arrow indicates the predicted short form of PASG. MEF cell lysate was immunoprecipitated with anti-lsh antibody and Western analysis was done with a rabbit antiserum raised against a selected peptide in the C-terminal region of PASG as described in Materials and Methods.
Figure 2.
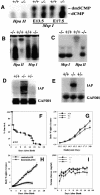
PASG-/- embryos and mice show genomic hypomethylation, gene re-expression, growth retardation, and early death. (A) Quantitation of methyl-cytosine in genomic DNA by thin layer chromatography shows decreased levels in PASG-/- embryonic DNA at gestation days 13.5 and 17.5. Equal amounts of genomic DNA from E13.5 body or E17.5 liver were digested with MspI, labeled at 5′ ends, redigested with nuclease P1 to generate 5′-deoxymononucleotides, which were separated by thin layer chromatography and quantitated using a PhosphorImager. The ratio of methyl-cytosine to total cytosine indicates the level of methylation at all CCGG sites. HpaII digests should not generate methyl-cytosine spots and they serve as controls, indicating the specificity of the assay. (B) Methylation-sensitive restriction enzyme digestion with HpaII using a probe for minor satellite centromeric DNA repeats in thymus from mice at day 15 after birth shows hypomethylation in PASG-/- mice. (C) Methylation-sensitive restriction enzyme assay with HpaII using a probe for IAP in kidneys from mice at postnatal day 15. The low molecular weight fragments indicate demethylated restriction sites, whereas high molecular weight fragments indicate methylated restriction sites. (D,E) Northern blot analysis of IAP expression in PASG-/- mice and MEFs shows re-expression of IAP transcripts in mutant mice (D; day 15 after birth) and fibroblasts (E) compared to no expression in control animals or cells. (F) Survival curve of 63 PASG-/- mice from 30 litters. (G) The growth curve of PASG-/- embryos shows growth retardation that becomes statistically significant by about gestation day 15.5. Each data point is derived from at least three litters. (H) The growth curve of the surviving PASG-/- mice demonstrates profound postnatal growth retardation. (I) Glucose levels are 50% lower in PASG-/- mice compared to heterozygotic mutant or wild-type animals during postnatal life. Blood glucose levels were determined by applying whole blood to “one touch” strips (Ultra, Lifespan). Each data point presents at least three mice.
Figure 3.
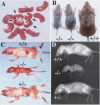
PASG-/- mice age prematurely. (A) Newborn mice. PASG-/- mice (arrows) appear morphologically normal except for their smaller size. (B) PASG-/- mice (shown at day 17) rapidly develop gray hair and balding. (C) PASG-/- mice at day 15 show loss of body mass, muscle atrophy, cachexia, and a profound decrease in adipose tissue. (D) Surviving PASG-/- mice at 15 d of age show kyphosis.
Figure 4.
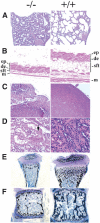
Histological changes of PASG-/- mice demonstrate multiorgan abnormalities and skeletal defects. (A) Diffuse alveolar atelectasis of the lung from a newborn PASG-/- mouse that contrasts with that of a control littermate lung, which shows normal alveolar expansion (100×). (B) PASG-/- skin exhibits hyperkeratosis and essentially complete absence of subcutaneous fat tissue (100×). (ep) Epidermis; (de) dermis; (sft) subcutaneous fat tissue; (m) muscle. (C) The thymus from a 2.5-week-old PASG-/- mouse is smaller than that of control mice and characterized by severe lymphoid depletion and scattered lymphoid necrosis (100×). (D) Kidneys from PASG-/- mice show tubular degeneration and dilation, epithelial attenuation, and accumulation of age-specific eosinophilic cytoplasmic inclusions (arrow) compared to kidneys from control mice (400×). (E) von Kossa staining of tibiae from 15-day-old mice shows that secondary ossification of epiphyses is delayed in PASG-/- animals. The calcified trabecular bone is fully formed in wild-type mice, but only calcified cartilage is observed in mutant mice. Both cortical and trabecular volume are diminished in PASG-/- mice (25×). (F) von Kossa staining of a thoracic vertebral body from 15-day-old animals demonstrates diminished cortical and trabecular volume in the PASG-/- mice (25×).
Figure 5.
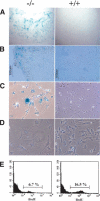
Increased expression of the senescence biomarker, β-galactosidase, and decreased incorporation of BrdU in PASG-/- mice and/or MEFs. (A,B) β-Galactosidase positive cells are found in PASG-/- tubules of the renal cortex (A) and the thymus (B). Tissues from normal littermates did not show increased expression of this marker of senescence. (C) PASG-/- MEFs show increased β-galactosidase-positive cells compared to wild-type MEFs (passage 5). (D) PASG-/- MEFs showed a flattened and enlarged morphology compared to the normal morphology of the wild-type MEFs (passage 5), consistent with a senescence phenotype. (E) PASG-/- thymus cells from 14-day-old mice show significantly decreased incorporation of BrdU compared with PASG+/+ littermates (6.1 ± 0.8% in PASG-/- mice compared with 15.5 ± 1.4% in PASG+/+ mice, p < 0.001, n = 4).
Figure 6.
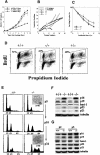
PASG-/- phenotype is associated with decreased growth potential, replicative senescence, and altered expression of p16INK4a, p19ARF, bmi-1, p53, and p21. (A) Growth kinetics of MEFs (passage 1) demonstrate that the time to increase to fivefold the initial number of plated cells is 3.6, 3.8, and 6.0 d for wild-type, heterozygous, and homozygous mutant MEFs, respectively. The average of two cell lines of each genotype done in triplicate is shown. (B) Population doublings are lower in PASG-/- MEFs, which, however, can be rescued by SV40 Large T-antigen. The arrow indicates the time of transfection with SV40 large T-antigen containing retroviral supernatants. The average of two cell lines of each genotype done in triplicate is shown. (C) PASG-/- MEFs (passage 3) are more resistant to γ-irradiation than control MEFs. The number of surviving cells relative to unirradiated cultures of each genotype is plotted as a function of the dose of radiation. The average of two cell lines of each genotype done in triplicate is shown. (D) PASG-/--derived MEFs show a significant decrease of cycling cells. MEFs (passage 5) were continuously labeled with BrdU for 48 h and then analyzed by flow cytometry to determine the percentage of actively cycling cells. The average of two cell lines of each genotype is shown. (E) Aneuploidy is increased in PASG-/- MEFs over time. PASG-/- MEFs display diploid (n = 40) from early passages, but profoundly abnormal DNA content and increased chromosome numbers from late passages compared to comparatively stable wild-type MEFs. (F) Increased level of p16INK4a, p53, and p21 and decreased level of bmi-1 are observed in the kidney of PASG-/- mice. (G) Increased level of p16INK4a and p19ARF and decreased level of bmi-1 are observed in PASG-/- MEFs at passage 2 (P2) and passage 5 (P5).
Similar articles
- Altered epigenetic patterning leading to replicative senescence and reduced longevity. A role of a novel SNF2 factor, PASG.
Sun LQ, Arceci RJ. Sun LQ, et al. Cell Cycle. 2005 Jan;4(1):3-5. doi: 10.4161/cc.4.1.1341. Epub 2005 Jan 3. Cell Cycle. 2005. PMID: 15611660 - Stable knockdown of PASG enhances DNA demethylation but does not accelerate cellular senescence in TIG-7 human fibroblasts.
Suzuki T, Farrar JE, Yegnasubramanian S, Zahed M, Suzuki N, Arceci RJ. Suzuki T, et al. Epigenetics. 2008 Sep;3(5):281-91. doi: 10.4161/epi.3.5.6914. Epub 2008 Sep 3. Epigenetics. 2008. PMID: 18948754 Free PMC article. - An SNF2 factor involved in mammalian development and cellular proliferation.
Raabe EH, Abdurrahman L, Behbehani G, Arceci RJ. Raabe EH, et al. Dev Dyn. 2001 May;221(1):92-105. doi: 10.1002/dvdy.1128. Dev Dyn. 2001. PMID: 11357197 - Stem cell self-renewal and cancer cell proliferation are regulated by common networks that balance the activation of proto-oncogenes and tumor suppressors.
Pardal R, Molofsky AV, He S, Morrison SJ. Pardal R, et al. Cold Spring Harb Symp Quant Biol. 2005;70:177-85. doi: 10.1101/sqb.2005.70.057. Cold Spring Harb Symp Quant Biol. 2005. PMID: 16869752 Review. - Helicase homologues maintain cytosine methylation in plants and mammals.
Bourc'his D, Bestor TH. Bourc'his D, et al. Bioessays. 2002 Apr;24(4):297-9. doi: 10.1002/bies.10078. Bioessays. 2002. PMID: 11948614 Review.
Cited by
- CDCA7-associated global aberrant DNA hypomethylation translates to localized, tissue-specific transcriptional responses.
Vukic M, Chouaref J, Della Chiara V, Dogan S, Ratner F, Hogenboom JZM, Epp TA, Chawengsaksophak K, Vonk KKD, Breukel C, Ariyurek Y, San Leon Granado D, Kloet SL, Daxinger L. Vukic M, et al. Sci Adv. 2024 Feb 9;10(6):eadk3384. doi: 10.1126/sciadv.adk3384. Epub 2024 Feb 9. Sci Adv. 2024. PMID: 38335290 Free PMC article. - HELLS modulates the stemness of intrahepatic cholangiocarcinoma through promoting senescence-associated secretory phenotype.
Du X, Zhang X, Qi Z, Zeng Z, Xu Y, Yu Z, Cao X, Xia J. Du X, et al. Comput Struct Biotechnol J. 2023 Oct 7;21:5174-5185. doi: 10.1016/j.csbj.2023.09.020. eCollection 2023. Comput Struct Biotechnol J. 2023. PMID: 37920816 Free PMC article. - Lost in HELLS: Disentangling the mystery of SALNR existence in senescence cellular models.
Consiglio A, Venturin M, Briguglio S, Rossi C, Grillo G, Bellosta S, Cattaneo MG, Licciulli F, Battaglia C. Consiglio A, et al. PLoS One. 2023 May 30;18(5):e0286104. doi: 10.1371/journal.pone.0286104. eCollection 2023. PLoS One. 2023. PMID: 37252915 Free PMC article. - Chromatin remodelers HELLS, WDHD1 and BAZ1A are dynamically expressed during mouse spermatogenesis.
Prakash Yadav R, Leskinen S, Ma L, Mäkelä JA, Kotaja N. Prakash Yadav R, et al. Reproduction. 2022 Dec 2;165(1):49-63. doi: 10.1530/REP-22-0240. Print 2023 Jan 1. Reproduction. 2022. PMID: 36194437 Free PMC article. - Mammalian Resilience Revealed by a Comparison of Human Diseases and Mouse Models Associated With DNA Helicase Deficiencies.
Kohzaki M. Kohzaki M. Front Mol Biosci. 2022 Aug 11;9:934042. doi: 10.3389/fmolb.2022.934042. eCollection 2022. Front Mol Biosci. 2022. PMID: 36032672 Free PMC article. Review.
References
- Bandyopadhyay D. and Medrano, E.E. 2003. The emerging role of epigenetics in cellular and organismal aging. Exp. Gerontol. 38: 1299-1307. - PubMed
- Bird A. 2002. DNA methylation patterns and epigenetic memory. Genes & Dev. 16: 6-21. - PubMed
- Campisi J. 1996. Replicative senescence: An old lives' tale? Cell 84: 497-500. - PubMed
Publication types
MeSH terms
Substances
LinkOut - more resources
Full Text Sources
Other Literature Sources
Medical
Molecular Biology Databases
