Foxo transcription factors induce the atrophy-related ubiquitin ligase atrogin-1 and cause skeletal muscle atrophy - PubMed (original) (raw)
Foxo transcription factors induce the atrophy-related ubiquitin ligase atrogin-1 and cause skeletal muscle atrophy
Marco Sandri et al. Cell. 2004.
Abstract
Skeletal muscle atrophy is a debilitating response to fasting, disuse, cancer, and other systemic diseases. In atrophying muscles, the ubiquitin ligase, atrogin-1 (MAFbx), is dramatically induced, and this response is necessary for rapid atrophy. Here, we show that in cultured myotubes undergoing atrophy, the activity of the PI3K/AKT pathway decreases, leading to activation of Foxo transcription factors and atrogin-1 induction. IGF-1 treatment or AKT overexpression inhibits Foxo and atrogin-1 expression. Moreover, constitutively active Foxo3 acts on the atrogin-1 promoter to cause atrogin-1 transcription and dramatic atrophy of myotubes and muscle fibers. When Foxo activation is blocked by a dominant-negative construct in myotubes or by RNAi in mouse muscles in vivo, atrogin-1 induction during starvation and atrophy of myotubes induced by glucocorticoids are prevented. Thus, forkhead factor(s) play a critical role in the development of muscle atrophy, and inhibition of Foxo factors is an attractive approach to combat muscle wasting.
Figures
Figure 1
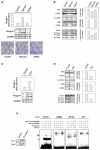
Starving Cells and Glucocorticoid Treatment Induce atrogin-1 Expression and Dephosphorylation of Members of the PI3K/AKT-Signaling Pathway (A and B) C2C12 myotubes were starved by removal of growth medium and incubated in PBS for 6 hr. Medium was replaced in refed samples for 12 hr. (A) Effect of starvation on atrogin-1 expression: Northern blots probed for atrogin-1 and GAPDH (middle image) and fold increase in atrogin-1 mRNA, calculated by dividing the atrogin-1 band intensity (atrogin-1/GADPH) with the atrogin-1/GADPH ratio in the control condition (upper image). Both atrogin-1 bands were used in the analysis. Micrographs of representative control, starved, and refed C2C12 myotube cultures (lower image). (B) Effect of starvation on components of the PI3K/AKT pathway: proteins were extracted from the same samples as in a, and subjected to immunoblot analysis. Quantitation of the ratio of phosphorylated to total protein was determined as above. Data was normalized to a control of 100%. (C) Effect of 1 μM Dex treatment on atrogin-1 expression. (D) Effect of Dex on PI3K/AKT pathway components. (E) Foxo factors are nuclear in starved C2C12 myotubes. Left image: nuclear extracts from control and starved myotubes were immunoblotted with anti-Foxo antibodies. Right image: nuclear extracts were tested for binding to double-stranded 32P-labeled oligonucleotides containing Foxo, CREB, NFκB, and AP1 binding sites by electrophoretic mobility shift assay. Arrow, Foxo–oligonucleotide complexes. Asterix, nonspecific band.
Figure 2
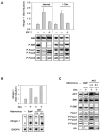
IGF-1 and AKT Block the Induction of atrogin-1 by Starvation and Dex Treatment and Cause Foxo Phosphorylation (A) Myotubes were incubated in the absence or presence of IGF-1 (10 ng/ml) and concomitantly starved (for 6 hr) or treated with Dex (for 24 hr). Northern blots were performed for atrogin-1 expression (upper image) and the amount and phosphorylation of AKT pathway members assayed by immunoblot (lower image) as in Figure 1. (B) Myotubes were infected with adenoviral vectors for c.a. AKT, d.n. AKT, or with control virus (βgal). 36 hr after infection, half the myotubes were treated with 1 μM Dex for 24 hr, and atrogin-1 expression analyzed by Northern. (C) Immunoblots for AKT and its downstream targets in the cultures from (B), overexpressed proteins were detected by anti-HA immunoblot.
Figure 3
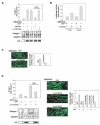
Foxo3 Induces atrogin-1 Expression and Causes Reduction in Myotube Size (A) Foxo3 induces atrogin-1 expression. Myotubes were infected with adenoviral vectors for FOXO3A and c.a. FOXO3A in the absence or presence of IGF-1 (10 ng/ml) and after 48 hr, atrogin-1 mRNA levels were assayed and depicted as in Figure 1. Overexpressed proteins were detected by anti-HA immunoblot. (B) The atrogin-1 promoter is activated by Foxo3. Myoblasts were transfected with the atrogin-1 reporter constructs 1.0AT1 or 3.5AT1, differentiated for four days, and then infected with FOXO3A or with a control (GFP) vector for 24 hr. Extracts were assayed for Firefly and Renilla luciferase activity. Firefly/Renilla activity was normalized to 1.0 in the control (GFP) infection. (C) Fluorescence microscopy of myotube cultures overexpressing Foxo3. Myotube cultures were infected with control adenovirus (GFP) or c.a. FOXO3A and photographed 48 hr after infection. Mean myotube diameter from each culture was quantified from three independent experiments. (D) D.n. Foxo3 inhibits dex-induced atrogin-1 expression and reduction in myotube diameter. Myotubes were infected with adenoviral vectors expressing d.n. FOXO3A, c.a. FOXO3A, or GFP, and incubated in the absence or presence of 1 μM Dex for 24 hr. Overexpressed d.n. FOXO3A was detected by anti-HA immunoblot. Left image: Northern analysis of atrogin-1 expression. Middle image: fluorescence microscopy of myotube cultures after 48 hr. Right image: quantification of mean myotube diameters in the presence of Dex and Foxo expression.
Figure 4
Foxo3, but Not Other AKT Targets, Activates atrogin-1 Expression (A) Myotubes were infected with various adenoviral vectors for 48 hr and then atrogin-1 expression was analyzed (upper image). Overexpressed proteins were detected by anti-HA immunoblots (lower image). (B) Myoblasts were transfected with 3.5AT1, differentiated, and infected with the indicated vectors. Luciferase activity in extracts from these cultures was analyzed as in Figure 3B. Results are normalized to the control GFP infection.
Figure 5
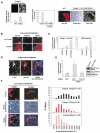
AKT Suppresses and Foxo Stimulates atrogin-1 Expression and Foxo Activation Causes Marked Atrophy of Mouse Muscle Fibers (A) AKT prevents induction of atrogin-1 expression by fasting. Left image: mouse tibialis anterior muscles were transfected by electroporation with the 3.5AT1 and pRL-TK. Seven days later, the mice were fed or fasted and then sacrificed. Firefly and Renilla luciferase activity was measured in muscle extracts. In situ hybridization on sections from muscles of fed and fasted mice (left image, insert). Scale bar is equal to 60 μm. Middle image: muscles were cotransfected with 3.5AT1, pRL-TK, and either c.a. HA-AKT or the parent vector. Seven days later, the mice were fasted for 24 hr and sacrificed. Firefly/Renilla luciferase activity was measured. Right image: serial cross-sections of these transfected muscles were processed for immunofluorescence with anti-HA antibody or for in situ hybridization with an atrogin-1 antisense probe. Scale bar is equal to 50 μm. (B) Nuclear localization of c.a. FOXO3A. Sections of adult tibialis anterior muscles transfected with c.a. FOXO3A or FOXO3A were prepared and visualized with anti-HA antibodies (for Foxo) and Hoechst staining (for nuclei) four days after infection. Images were merged to demonstrate colocalization. Scale bars are equal to 20 μm for c.a. FOXO3A and 30 μm for FOXO3A. (C) Foxo3 activates the atrogin-1 promoter in transfected muscle fibers. Muscles were cotransfected with 3.5AT1, pRL-TK, and with either FOXO3A or c.a. FOXO3A as described above. Similarly, a Foxo reporter (DBE promoter) was transfected in place of the atrogin-1 reporter. Luciferase activity was measured four days after transfection. (D) Atrogin-1 mRNA is increased in muscle fibers overexpressing Foxo3. Cross-sections of tibialis anterior muscle transfected with c.a. FOXO3A were processed for immunofluorescence with anti-HA antibody or for in situ hybridization for atrogin-1 four days after transfection. Atrogin-1 transcripts are increased in Foxo3 overexpressing fibers, in close proximity to the Foxo3-positive nuclei (arrow) Scale bar is equal to 40 μm. (E) siRNA-mediated knockdown of Foxo1-3 inhibits atrogin-1 promoter activity during fasting. Left image: adult skeletal muscle was cotransfected with _pSUPER_-vectors, pRL-TK and 3.5AT1. Seven days later, the mice were fasted and sacrificed. Firefly/renilla luciferase activity was measured as above. Right image: Foxo1 and 3 protein level detected by immunoblot in myotubes. (F) Foxo3 expression for 8 or 14 days causes marked muscle fiber atrophy. Left images: adult tibialis anterior muscles were transfected with c.a. FOXO3A and mice were sacrificed after 8 or 14 days. Atrophic fibers expressing c.a. FOXO3A were detected in transverse sections stained with anti-HA (for Foxo) (asterix in eight day micrograph) For eight days, scale bar is equal to 50 μm. For 14 days, scale bar is equal to 20 μm. Right images: frequency histograms showing the distribution of cross-sectional areas (μm2) of fibers expressing c.a. FOXO3A for eight days (red bars) or 14 days (pink bars) and surrounding untransfected fibers (control fibers) (black bars).
Figure 6
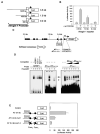
Foxo Binding Sites Are Required for atrogin-1 Promoter Activation by Foxo3 (A) Serial truncations of the atrogin-1 promoter were fused to the firefly luciferase gene. (B) The atrogin-1 reporters and pRL-TK were transfected into adult muscle in presence or in absence of c.a. FOXO3A as above. Mice were sacrificed four days after transfection and muscles were assayed for luciferase activity. (C) The atrogin-1 promoter. Multiple forkhead consensus binding sites are noted by black circles. Potential forkhead binding site (Foxo1) present in smallest promoter truncation, used in the gel-shift experiment in (D), as well as the mutated version are shown. (D) Purified FoxoGST protein was tested for binding to double-stranded 32P-labeled oligonucleotides containing the IGFBP1 site, AT Foxo 1 and AT Foxo 1 mut sites by electrophoretic mobility shift assay as described in Experimental Procedures. Arrow, FoxoGST–oligonucleotide complexes. Asterix, nonspecific band. (E) Left image: mutations in the 0.4 kb atrogin-1 luciferase reporter constructs. The two putative Foxo sites are noted by black circles and mutations by X. Right image: adult muscle were transfected with the atrogin-1 reporters described in the left image together with pRL-TK and c.a. FOXO3A and luciferase activity measured.
Figure 7
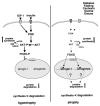
A Summary of the Roles of the IGF-1/AKT Pathway and Foxo in Muscle Atrophy (right image) and Hypertrophy (left image) Factors and pathways in bold are activated (see text for details).
Similar articles
- The IGF-1/PI3K/Akt pathway prevents expression of muscle atrophy-induced ubiquitin ligases by inhibiting FOXO transcription factors.
Stitt TN, Drujan D, Clarke BA, Panaro F, Timofeyva Y, Kline WO, Gonzalez M, Yancopoulos GD, Glass DJ. Stitt TN, et al. Mol Cell. 2004 May 7;14(3):395-403. doi: 10.1016/s1097-2765(04)00211-4. Mol Cell. 2004. PMID: 15125842 - Transgenic overexpression of locally acting insulin-like growth factor-1 inhibits ubiquitin-mediated muscle atrophy in chronic left-ventricular dysfunction.
Schulze PC, Fang J, Kassik KA, Gannon J, Cupesi M, MacGillivray C, Lee RT, Rosenthal N. Schulze PC, et al. Circ Res. 2005 Sep 2;97(5):418-26. doi: 10.1161/01.RES.0000179580.72375.c2. Epub 2005 Jul 28. Circ Res. 2005. PMID: 16051886 - IGF-1 prevents ANG II-induced skeletal muscle atrophy via Akt- and Foxo-dependent inhibition of the ubiquitin ligase atrogin-1 expression.
Yoshida T, Semprun-Prieto L, Sukhanov S, Delafontaine P. Yoshida T, et al. Am J Physiol Heart Circ Physiol. 2010 May;298(5):H1565-70. doi: 10.1152/ajpheart.00146.2010. Epub 2010 Mar 12. Am J Physiol Heart Circ Physiol. 2010. PMID: 20228261 Free PMC article. - Signalling pathways that mediate skeletal muscle hypertrophy and atrophy.
Glass DJ. Glass DJ. Nat Cell Biol. 2003 Feb;5(2):87-90. doi: 10.1038/ncb0203-87. Nat Cell Biol. 2003. PMID: 12563267 Review. - Skeletal muscle hypertrophy and atrophy signaling pathways.
Glass DJ. Glass DJ. Int J Biochem Cell Biol. 2005 Oct;37(10):1974-84. doi: 10.1016/j.biocel.2005.04.018. Int J Biochem Cell Biol. 2005. PMID: 16087388 Review.
Cited by
- Alpha-ketoglutarate promotes skeletal muscle hypertrophy and protein synthesis through Akt/mTOR signaling pathways.
Cai X, Zhu C, Xu Y, Jing Y, Yuan Y, Wang L, Wang S, Zhu X, Gao P, Zhang Y, Jiang Q, Shu G. Cai X, et al. Sci Rep. 2016 May 26;6:26802. doi: 10.1038/srep26802. Sci Rep. 2016. PMID: 27225984 Free PMC article. Retracted. - Regulation of nicotinic acetylcholine receptor turnover by MuRF1 connects muscle activity to endo/lysosomal and atrophy pathways.
Rudolf R, Bogomolovas J, Strack S, Choi KR, Khan MM, Wagner A, Brohm K, Hanashima A, Gasch A, Labeit D, Labeit S. Rudolf R, et al. Age (Dordr). 2013 Oct;35(5):1663-74. doi: 10.1007/s11357-012-9468-9. Epub 2012 Sep 6. Age (Dordr). 2013. PMID: 22956146 Free PMC article. - Glucocorticoids Enhance Muscle Proteolysis through a Myostatin-Dependent Pathway at the Early Stage.
Wang R, Jiao H, Zhao J, Wang X, Lin H. Wang R, et al. PLoS One. 2016 May 26;11(5):e0156225. doi: 10.1371/journal.pone.0156225. eCollection 2016. PLoS One. 2016. PMID: 27227776 Free PMC article. - MyomiRs as Markers of Insulin Resistance and Decreased Myogenesis in Skeletal Muscle of Diet-Induced Obese Mice.
Frias Fde T, de Mendonça M, Martins AR, Gindro AF, Cogliati B, Curi R, Rodrigues AC. Frias Fde T, et al. Front Endocrinol (Lausanne). 2016 Jun 27;7:76. doi: 10.3389/fendo.2016.00076. eCollection 2016. Front Endocrinol (Lausanne). 2016. PMID: 27445979 Free PMC article. - Disassociation of insulin action and Akt/FOXO signaling in skeletal muscle of older Akt-deficient mice.
Reynolds TH 4th, Merrell E, Cinquino N, Gaugler M, Ng L. Reynolds TH 4th, et al. Am J Physiol Regul Integr Comp Physiol. 2012 Dec;303(11):R1186-94. doi: 10.1152/ajpregu.00358.2012. Epub 2012 Oct 24. Am J Physiol Regul Integr Comp Physiol. 2012. PMID: 23100026 Free PMC article.
References
- Bodine SC, Latres E, Baumhueter S, Lai VK, Nunez L, Clarke BA, Poueymirou WT, Panaro FJ, Na E, Dharmarajan K, et al. Identification of ubiquitin ligases required for skeletal muscle atrophy. Science. 2001a;294:1704–1708. - PubMed
- Bodine SC, Stitt TN, Gonzalez M, Kline WO, Stover GL, Bauerlein R, Zlotchenko E, Scrimgeour A, Lawrence JC, Glass DJ, Yancopoulos GD. Akt/mTOR pathway is a crucial regulator of skeletal muscle hypertrophy and can prevent muscle atrophy in vivo. Nat. Cell Biol. 2001b;3:1014–1019. - PubMed
- Brummelkamp TR, Bernards R, Agami R. A system for stable expression of short interfering RNAs in mammalian cells. Science. 2002;296:550–553. - PubMed
- Brunet A, Bonni A, Zigmond MJ, Lin MZ, Juo P, Hu LS, Anderson MJ, Arden KC, Blenis J, Greenberg ME. Akt promotes cell survival by phosphorylating and inhibiting a Forkhead transcription factor. Cell. 1999;96:857–868. - PubMed
Publication types
MeSH terms
Substances
Grants and funding
- DK02707/DK/NIDDK NIH HHS/United States
- R01 AG015052/AG/NIA NIH HHS/United States
- R01 AR040197/AR/NIAMS NIH HHS/United States
- DK62307/DK/NIDDK NIH HHS/United States
- R01 DK062307/DK/NIDDK NIH HHS/United States
LinkOut - more resources
Full Text Sources
Other Literature Sources
Molecular Biology Databases
Research Materials
Miscellaneous
