ASAView: database and tool for solvent accessibility representation in proteins - PubMed (original) (raw)
ASAView: database and tool for solvent accessibility representation in proteins
Shandar Ahmad et al. BMC Bioinformatics. 2004.
Abstract
Background: Accessible surface area (ASA) or solvent accessibility of amino acids in a protein has important implications. Knowledge of surface residues helps in locating potential candidates of active sites. Therefore, a method to quickly see the surface residues in a two dimensional model would help to immediately understand the population of amino acid residues on the surface and in the inner core of the proteins.
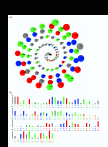
Results: ASAView is an algorithm, an application and a database of schematic representations of solvent accessibility of amino acid residues within proteins. A characteristic two-dimensional spiral plot of solvent accessibility provides a convenient graphical view of residues in terms of their exposed surface areas. In addition, sequential plots in the form of bar charts are also provided. Online plots of the proteins included in the entire Protein Data Bank (PDB), are provided for the entire protein as well as their chains separately.
Conclusions: These graphical plots of solvent accessibility are likely to provide a quick view of the overall topological distribution of residues in proteins. Chain-wise computation of solvent accessibility is also provided.
Figures
Figure 1
ASAView of a DNA binding protein (PDB code 1CMA chain A). (a) The spiral view, which shows amino acid residues of 1CMA, in the order of their solvent accessibility. Most accessible residues come on the outermost ring of this spiral. Blue, red, green, gray colors are used for positively charged, negatively charged, polar and non-polar residues respectively. Yellow color is used for Cystein residues. Radius of the solid circles representing these residues corresponds to the relative solvent accessibility (b) Solvent accessibility of residues, with residues arranged in the original order as in their PDB file. Length of the bar represents the ASA in units relative to extended state ASA of that residue.
Similar articles
- Look-up tables for protein solvent accessibility prediction and nearest neighbor effect analysis.
Wang JY, Ahmad S, Gromiha MM, Sarai A. Wang JY, et al. Biopolymers. 2004 Oct 15;75(3):209-16. doi: 10.1002/bip.20113. Biopolymers. 2004. PMID: 15378480 - Atom-wise statistics and prediction of solvent accessibility in proteins.
Singh YH, Gromiha MM, Sarai A, Ahmad S. Singh YH, et al. Biophys Chem. 2006 Nov 20;124(2):145-54. doi: 10.1016/j.bpc.2006.06.013. Epub 2006 Jul 24. Biophys Chem. 2006. PMID: 16860924 - Solvent accessibility in native and isolated domain environments: general features and implications to interface predictability.
Raih MF, Ahmad S, Zheng R, Mohamed R. Raih MF, et al. Biophys Chem. 2005 Apr 1;114(1):63-9. doi: 10.1016/j.bpc.2004.10.005. Epub 2004 Nov 23. Biophys Chem. 2005. PMID: 15792862 - A review of methods available to estimate solvent-accessible surface areas of soluble proteins in the folded and unfolded states.
Ali SA, Hassan MI, Islam A, Ahmad F. Ali SA, et al. Curr Protein Pept Sci. 2014;15(5):456-76. doi: 10.2174/1389203715666140327114232. Curr Protein Pept Sci. 2014. PMID: 24678666 Review. - Molecular design opportunities presented by solvent-exposed regions of target proteins.
Jiang X, Yu J, Zhou Z, Kongsted J, Song Y, Pannecouque C, De Clercq E, Kang D, Poongavanam V, Liu X, Zhan P. Jiang X, et al. Med Res Rev. 2019 Nov;39(6):2194-2238. doi: 10.1002/med.21581. Epub 2019 Apr 19. Med Res Rev. 2019. PMID: 31002405 Review.
Cited by
- The Comparison Between the Mutated HuIFN-β 27-101 and the Wild Type Interferon β: the Comprehensive In Silico Study to Evaluate the Effect of Mutations on IFN-β.
Balkhi SS, Hojati Z. Balkhi SS, et al. Adv Pharm Bull. 2019 Oct;9(4):640-648. doi: 10.15171/apb.2019.074. Epub 2019 Oct 24. Adv Pharm Bull. 2019. PMID: 31857969 Free PMC article. - Protein evolution via amino acid and codon elimination.
Goltermann L, Larsen MS, Banerjee R, Joerger AC, Ibba M, Bentin T. Goltermann L, et al. PLoS One. 2010 Apr 26;5(4):e10104. doi: 10.1371/journal.pone.0010104. PLoS One. 2010. PMID: 20436666 Free PMC article. - Control of Solvent Dynamics around the B12-Dependent Ethanolamine Ammonia-Lyase Enzyme in Frozen Aqueous Solution by Using Dimethyl Sulfoxide Modulation of Mesodomain Volume.
Nforneh B, Warncke K. Nforneh B, et al. J Phys Chem B. 2019 Jul 5;123(26):5395-5404. doi: 10.1021/acs.jpcb.9b02239. Epub 2019 Jun 19. J Phys Chem B. 2019. PMID: 31244099 Free PMC article. - Boosted activity by engineering the enzyme microenvironment in cascade reaction: A molecular understanding.
Wang J, Zhang H, Yin D, Xu X, Tan T, Lv Y. Wang J, et al. Synth Syst Biotechnol. 2021 Jul 6;6(3):163-172. doi: 10.1016/j.synbio.2021.06.004. eCollection 2021 Sep. Synth Syst Biotechnol. 2021. PMID: 34278014 Free PMC article. - Structural basis of Cu, Zn-superoxide dismutase amyloid fibril formation involves interaction of multiple peptide core regions.
Ida M, Ando M, Adachi M, Tanaka A, Machida K, Hongo K, Mizobata T, Yamakawa MY, Watanabe Y, Nakashima K, Kawata Y. Ida M, et al. J Biochem. 2016 Feb;159(2):247-60. doi: 10.1093/jb/mvv091. Epub 2015 Aug 29. J Biochem. 2016. PMID: 26319711 Free PMC article.
References
- Rost B, Sander C. Conservation and prediction of solvent accessibility in protein families. Proteins. 1994;20:216–226. - PubMed
Publication types
MeSH terms
Substances
LinkOut - more resources
Full Text Sources
Other Literature Sources
