An array of coactivators is required for optimal recruitment of TATA binding protein and RNA polymerase II by promoter-bound Gcn4p - PubMed (original) (raw)
An array of coactivators is required for optimal recruitment of TATA binding protein and RNA polymerase II by promoter-bound Gcn4p
Hongfang Qiu et al. Mol Cell Biol. 2004 May.
Abstract
Wild-type transcriptional activation by Gcn4p is dependent on multiple coactivators, including SAGA, SWI/SNF, Srb mediator, CCR4-NOT, and RSC, which are all recruited by Gcn4p to its target promoters in vivo. It was not known whether these coactivators are required for assembly of the preinitiation complex (PIC) or for subsequent steps in the initiation or elongation phase of transcription. We find that mutations in subunits of these coactivators reduce the recruitment of TATA binding protein (TBP) and RNA polymerase II (Pol II) by Gcn4p at ARG1, ARG4, and SNZ1, implicating all five coactivators in PIC assembly at Gcn4p target genes. Recruitment of Pol II at SNZ1 and ARG1 was eliminated by mutations in TBP or by deletion of the TATA box, indicating that TBP binding is a prerequisite for Pol II recruitment by Gcn4p. However, several mutations in SAGA subunits and deletion of SRB10 had a greater impact on promoter occupancy of Pol II versus TBP, suggesting that SAGA and Srb mediator can promote Pol II binding independently of their stimulatory effects on TBP recruitment. Our results reveal an unexpected complexity in the cofactor requirements for the enhancement of PIC assembly by a single activator protein.
Figures
FIG. 1.
Gcn4p recruits TBP and Rpb3p to ARG1, SNZ1, and ARG4, dependent on hydrophobic residues in the activation domain. Strains HQY382 (_gcn4_Δ) and HQY366 (GCN4) in panel A, HQY422 (_gcn4_Δ) and HQY403 (GCN4) in panel B, and HQY382 and HQY422 carrying empty vector (_gcn4_Δ), pHQ1303 (GCN4), or pHQ1304 (gcn4-14Ala) in panel C were grown to optical densities at 600 nm (OD600) of 0.8 to 1.0 in SC-Ilv medium at 30°C and treated with SM at 0.6 μg/ml for 2 h. Cells were harvested, treated with formaldehyde, and lysed with glass beads, and the extracts were sonicated to produce chromatin fragments of ∼500 bp. Aliquots (5% of total) were immunoprecipitated with myc antibodies, and DNA was extracted from the immunoprecipitate (IP) after reversing the cross-links. DNA was extracted directly from another aliquot of chromatin (5% of the total) to serve as the input (Inp) control. A 1,000-fold dilution of the Inp and the undiluted IP samples were PCR amplified using primers specific for the _POL1_ORF, the _ARG1_TATA, the _SNZ1_TATA, or ARG4 promoter (UAS and TATA sequence), in the presence of [33P]dATP. The PCR products were resolved by polyacrylamide gel electrophoresis (PAGE), quantified by phosphorimaging, and visualized by autoradiography. The ratios of the _ARG1_TATA, _SNZ1_TATA, or ARG4 promoter signals to the POL1 signals in the IP were calculated and normalized for the corresponding ratios for the input samples from >9 independent measurements to produce the average ratio percent IP (ARG1/POL1) values listed immediately below the IP autoradiograms in panels A and B. The average ratios of the percent IP (ARG1/POL1) values in the GCN4 versus _gcn4_Δ strains were calculated and are listed on the second line below the IP autoradiograms in panels A and B, with standard errors given in parentheses. The corresponding ratio percent IP (_GCN4/gcn4_Δ) values are plotted in the histogram in panel C.
FIG. 2.
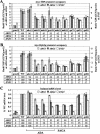
Deletions of multiple SAGA subunits decrease the recruitment of myc-TBP and myc-Rpb3p by Gcn4p and reduce mRNA levels at ARG1, ARG4, and SNZ1. (A and B) ChIP analysis of TBP1-myc strains (A) HQY382 (_gcn4_Δ), HQY366 (WT), HQY473 (_ahc1_Δ), HQY583 (_ada2_Δ), HQY584 (_ada3_Δ), HQY406 (_gcn5_Δ), HQY426 (_ada1_Δ), HQY407 (_ada5_Δ), HQY533 (_spt7_Δ), HQY427 (_spt3_Δ) and HQY530 (_spt8_Δ), and of RPB3-myc strains (B) HQY422 (_gcn4_Δ), HQY403 (WT), HQY560 (_ahc1_Δ), HQ589 (_ada2_Δ), HQY590 (_ada3_Δ), HQY445 (_gcn5_Δ), HQY432 (_ada1_Δ), HQY414 (_ada5_Δ), HQY535 (_spt7_Δ), HQY433 (_spt3_Δ), and HQY531 (_spt8_Δ) conducted as described in the legend to Fig. 1. The ratio percent IP (_GCN4/gcn4_Δ) values were calculated (as defined in the legend to Fig. 1) for the _ARG1_TATA, _SNZ1_TATA, and ARG4 probes. The average results obtained from ≥2 independent cultures and ≥2 PCR amplifications for each culture were plotted in the histograms with standard errors shown as error bars. Note the different scale on the y axis for the ratio percent IP (_GCN4/gcn4_Δ) for SNZ1. The numbers under the histograms, corresponding to the percentages of the WT Gcn4p-dependent binding of myc-TBP or myc-Rpb3p, were calculated by subtracting unity from all of the ratio percent IP (_GCN4/gcn4_Δ) values in the histogram and calculating the percentage of the resulting WT value obtained for each mutant. (C) Duplicate cultures of the TBP1-myc strains listed in panel A were grown under the same conditions employed for ChIP analysis, and total RNA samples were extracted and subjected to Northern analysis of ARG1, ARG4, and SNZ1 mRNAs with the SCR1 transcript as a loading control (see Fig. 5). The Northern signals from two independent blots for each duplicate culture were measured by phosphorimaging analysis and normalized for SCR1 RNA levels, and the mean value with standard error was plotted in the histogram as a fraction of the WT value. The numbers under the histograms were calculated by subtracting the values shown in the histogram for the _gcn4_Δ strain from the corresponding values for the other strains and expressing the resulting differences as percentages of the value obtained for the WT. None of the SAGA mutants showed any significant differences in mRNA levels among the TBP1-myc, RPB3-myc, and untagged strains (data not shown).
FIG. 3.
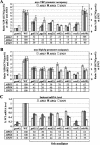
Deletions of multiple Srb mediator subunits decrease the recruitment of myc-TBP and myc-Rpb3p by Gcn4p and reduce mRNA levels at ARG1, ARG4, and SNZ1. (A and B) ChIP analysis of TBP1-myc strains (A) HQY382 (_gcn4_Δ), HQY366 (WT), HQY424 (_gal11_Δ), HQY405 (_pgd1_Δ), HQY425 (_med2_Δ), HQY594 (_srb2_Δ), HQY431 (_srb5_Δ), HQY534 (_rox3_Δ), and HQY423 (_srb10_Δ) and of RPB3-myc strains (B) HQY422 (_gcn4_Δ), HQY403 (WT), HQY412 (_gal11_Δ), HQY413 (_pgd1_Δ), HQY421 (_med2_Δ), HQY596 (_srb2_Δ), HQY559 (_srb5_Δ), HQY574 (_rox3_Δ), and HQY411 (_srb10_Δ) was conducted as described in the legends to Fig. 2A and B. (C) Northern analysis of the TBP1-myc strains listed in panel A, as described in the legend to Fig. 2C. Northern analysis of the RPB3-myc and untagged strains (data not shown) revealed that the reductions in mRNA levels observed in the TBP1-myc strains harboring _gal11_Δ, _med2_Δ, or _pgd1_Δ were more pronounced than those seen in the corresponding RPB3-myc and untagged strain versions of these mutants.
FIG. 4.
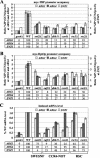
Deletions affecting SWI/SNF, CCR4-NOT, and RSC decrease the recruitment of myc-TBP and myc-Rpb3p by Gcn4p and reduce mRNA levels at ARG1, ARG4, and SNZ1. (A and B) ChIP analysis of TBP1-myc strains HQY382 (_gcn4_Δ), HQY366 (WT), HQY408 (_swi2_Δ), HQY410 (_caf1_Δ), HQY369 (_dhh1_Δ), HQY373 (_ccr4_Δ), HQY429 (_rsc1_Δ), and HQY430 (_rsc2_Δ) in panel A and of RPB3-myc strains HQY422 (_gcn4_Δ), HQY403 (WT), HQY415 (_swi2_Δ), HQY437 (_caf1_Δ), HQY575 (_dhh1_Δ), HQY444 (_ccr4_Δ), HQY417 (_rsc1_Δ), and HQY558 (_rsc2_Δ) in panel B was conducted as described in the legends to Fig. 2A and B. (C) Northern analysis of the TBP1-myc strains listed in panel A, as described in the legend to Fig. 2C. Northern analysis of the RPB3-myc and untagged strains (data not shown) revealed no significant differences between the mRNA levels observed in the TBP1-myc strains versus the RPB3-myc and untagged strains.
FIG. 5.
Effects of coactivator mutations on the induction of ARG1, ARG4, and SNZ1 mRNAs by Gcn4p. Representative results from the Northern analysis of TBP1-myc strains summarized in panels C of Fig. 2 to 4. The indicated mutant and WT strains were grown under the same inducing conditions used for ChIP assays. The SNZ1 and ARG4 mRNAs were probed along with SCR1 RNA on one set of blots, whereas ARG1 mRNA and SCR1 RNA were probed on a replicate blot.
FIG. 6.
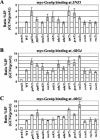
ChIP analysis of myc-Gcn4p binding to the SNZ1, ARG4, and ARG1 promoters in coactivator mutants. (A to C) A transformant of strain 249 carrying empty vector (_gcn4_Δ) and transformants of the strains containing single-copy GCN4-myc plasmid pSK1: HQY577 (_gal11_Δ), HQY513 (_pgd1_Δ), HQY591 (_med2_Δ), HQY592 (_rox3_Δ), HQY522 (_srb5_Δ), HQY523 (_ada1_Δ), HQY516 (_ada5_Δ), HQY578 (_spt7_Δ), HQY515 (_gcn5_Δ), HQY514 (_swi2_Δ), HQY532 (_ccr4_Δ), HQY647 (_rsc1_Δ), and HQY648 (_rsc2_Δ) were subjected to ChIP analysis as described in the legend to Fig. 1 to measure myc-Gcn4p binding at SNZ1 (A), ARG4 (B), and ARG1 (C).
FIG. 7.
Promoter occupancy of Pol II at ARG1 and ARG4 is not diminished by reductions in TBP recruitment. (A) ChIP analysis of TBP recruitment in tbp1 mutants. Strains HQY644 (_gcn4_Δ), BYΔ2 (WT), BYΔ2 ts-1 (tbp1-ts1) and BYΔ2 ts-2 (tbp1-ts2) were grown at 25°C to an optical density at 600 nm of 0.6 to 0.8, shifted to 37°C for 20 min, and cultured for 2 h at 37°C in the presence of SM to induce Gcn4p. ChIP analysis was conducted using TBP antibodies to measure TBP recruitment at ARG1, ARG4, and SNZ1 as described in the legend to Fig. 1. The results from duplicate cultures and replicate PCR amplifications for each culture were averaged and plotted as described in the legend to Fig. 2A. (B) Western analysis of TBP expression in tbp1 mutants. WCEs were prepared from the same cultures described in panel A were subjected to Western blot analysis using antibodies against TBP and Gcd6p, the latter serving as loading control. The ratios of TBP to Gcd6p were calculated by video densitometry using NIH image software and are listed beneath the TBP blot. (C) ChIP analysis of myc-Rpb3p recruitment in RPB3-myc strains HQY651 (_gcn4_Δ), HQY641 (WT), HQY642 (tbp1-ts1), and HQY643 (tbp1-ts2), conducted as described for panel A. (D) Northern analysis of tbp1 mutants. Strains BYΔ2 (WT), BYΔ2 ts-1 (tbp1-ts1) and BYΔ2 ts-2 (tbp1-ts2) were grown at 25°C to an optical density at 600 nm of 0.6 to 0.8, split into halves, and incubated at 37°C for 20 min. After adding SM to one half (+SM), both halves were incubated at 37°C for 2 h longer. Total RNA was subjected to Northern analysis, and the mean ARG1/SCR1, ARG4/SCR1, and SNZ1/SCR1 ratios, measured by phosphorimaging analysis of two independent blots, are listed as relative to the WT value beneath the autoradiograms.
FIG. 8.
TBP binding to TATA box is a prerequisite for recruitment of Pol II by Gcn4p. ChIP analysis of TBP1-myc strains (A) HQY382 (gcn4_Δ), HQY366 (WT), and HQY692 (Δ_TATA) and of RPB3-myc strains (B) HQY422 (gcn4_Δ), HQY403 (WT), and HQY693 (Δ_TATA) was conducted as described in the legend to Fig. 1. The ratio percent IP (_GCN4/gcn4_Δ) values were calculated (as defined in Fig. 1) for the _ARG1_TATA probe, and the average results obtained from two independent cultures and two PCR amplifications for each culture were plotted in the histogram (C) with standard errors shown as error bars.
Similar articles
- Interdependent recruitment of SAGA and Srb mediator by transcriptional activator Gcn4p.
Qiu H, Hu C, Zhang F, Hwang GJ, Swanson MJ, Boonchird C, Hinnebusch AG. Qiu H, et al. Mol Cell Biol. 2005 May;25(9):3461-74. doi: 10.1128/MCB.25.9.3461-3474.2005. Mol Cell Biol. 2005. PMID: 15831453 Free PMC article. - Simultaneous recruitment of coactivators by Gcn4p stimulates multiple steps of transcription in vivo.
Govind CK, Yoon S, Qiu H, Govind S, Hinnebusch AG. Govind CK, et al. Mol Cell Biol. 2005 Jul;25(13):5626-38. doi: 10.1128/MCB.25.13.5626-5638.2005. Mol Cell Biol. 2005. PMID: 15964818 Free PMC article. - A multiplicity of coactivators is required by Gcn4p at individual promoters in vivo.
Swanson MJ, Qiu H, Sumibcay L, Krueger A, Kim SJ, Natarajan K, Yoon S, Hinnebusch AG. Swanson MJ, et al. Mol Cell Biol. 2003 Apr;23(8):2800-20. doi: 10.1128/MCB.23.8.2800-2820.2003. Mol Cell Biol. 2003. PMID: 12665580 Free PMC article. - Role of the TATA-box binding protein (TBP) and associated family members in transcription regulation.
Mishal R, Luna-Arias JP. Mishal R, et al. Gene. 2022 Jul 30;833:146581. doi: 10.1016/j.gene.2022.146581. Epub 2022 May 18. Gene. 2022. PMID: 35597524 Review. - Roles for BTAF1 and Mot1p in dynamics of TATA-binding protein and regulation of RNA polymerase II transcription.
Pereira LA, Klejman MP, Timmers HT. Pereira LA, et al. Gene. 2003 Oct 2;315:1-13. doi: 10.1016/s0378-1119(03)00714-5. Gene. 2003. PMID: 14557059 Review.
Cited by
- Selective recognition of acetylated histones by bromodomains in transcriptional co-activators.
Hassan AH, Awad S, Al-Natour Z, Othman S, Mustafa F, Rizvi TA. Hassan AH, et al. Biochem J. 2007 Feb 15;402(1):125-33. doi: 10.1042/BJ20060907. Biochem J. 2007. PMID: 17049045 Free PMC article. - The mediator of RNA polymerase II.
Blazek E, Mittler G, Meisterernst M. Blazek E, et al. Chromosoma. 2005 Mar;113(8):399-408. doi: 10.1007/s00412-005-0329-5. Epub 2005 Feb 3. Chromosoma. 2005. PMID: 15690163 Review. - Recruitment of the ArgR/Mcm1p repressor is stimulated by the activator Gcn4p: a self-checking activation mechanism.
Yoon S, Govind CK, Qiu H, Kim SJ, Dong J, Hinnebusch AG. Yoon S, et al. Proc Natl Acad Sci U S A. 2004 Aug 10;101(32):11713-8. doi: 10.1073/pnas.0404652101. Epub 2004 Aug 2. Proc Natl Acad Sci U S A. 2004. PMID: 15289616 Free PMC article. - Dissection of coactivator requirement at RNR3 reveals unexpected contributions from TFIID and SAGA.
Zhang H, Kruk JA, Reese JC. Zhang H, et al. J Biol Chem. 2008 Oct 10;283(41):27360-27368. doi: 10.1074/jbc.M803831200. Epub 2008 Aug 5. J Biol Chem. 2008. PMID: 18682387 Free PMC article. - Interdependent recruitment of SAGA and Srb mediator by transcriptional activator Gcn4p.
Qiu H, Hu C, Zhang F, Hwang GJ, Swanson MJ, Boonchird C, Hinnebusch AG. Qiu H, et al. Mol Cell Biol. 2005 May;25(9):3461-74. doi: 10.1128/MCB.25.9.3461-3474.2005. Mol Cell Biol. 2005. PMID: 15831453 Free PMC article.
References
- Agalioti, T., S. Lomvardas, B. Parekh, J. Yie, T. Maniatis, and D. Thanos. 2000. Ordered recruitment of chromatin modifying and general transcription factors to the IFN-beta promoter. Cell 103:667-678. - PubMed
MeSH terms
Substances
LinkOut - more resources
Full Text Sources
Molecular Biology Databases
Research Materials
Miscellaneous


