Distinct localization of histone H3 acetylation and H3-K4 methylation to the transcription start sites in the human genome - PubMed (original) (raw)
Distinct localization of histone H3 acetylation and H3-K4 methylation to the transcription start sites in the human genome
Gangning Liang et al. Proc Natl Acad Sci U S A. 2004.
Abstract
Almost 1-2% of the human genome is located within 500 bp of either side of a transcription initiation site, whereas a far larger proportion (approximately 25%) is potentially transcribable by elongating RNA polymerases. This observation raises the question of how the genome is packaged into chromatin to allow start sites to be recognized by the regulatory machinery at the same time as transcription initiation, but not elongation, is blocked in the 25% of intragenic DNA. We developed a chromatin scanning technique called ChAP, coupling the chromatin immunoprecipitation assay with arbitrarily primed PCR, which allows for the rapid and unbiased comparison of histone modification patterns within the eukaryotic nucleus. Methylated lysine 4 (K4) and acetylated K9/14 of histone H3 were both highly localized to the 5' regions of transcriptionally active human genes but were greatly decreased downstream of the start sites. Our results suggest that the large transcribed regions of human genes are maintained in a deacetylated conformation in regions read by elongating polymerase. Common models depicting widespread histone acetylation and K4 methylation throughout the transcribed unit do not therefore apply to the majority of human genes.
Figures
Fig. 1.
Typical ChAP assay and validation by conventional ChIP assay. T24 cells were treated with formaldehyde and immunoprecipitated with antibodies specific for MeCP2 as a control (inactive marker), acetylated H3-K9/14, and dimethylated H3-K4. The final precipitated DNA was used for AP-PCR and conventional ChIP-PCR. (A) ChAP assay (which combines ChIP and AP-PCR). The ChAP fingerprinting assay gel was generated by using radioactively labeled AP-PCR products. Arrows represent bands with potentially interesting patterns, which were subsequently isolated from the gel and sequenced. Solid arrows represent bands precipitated by antibodies specific to active chromatin markers (acetylated H3-K9/14 and dimethylated H3-K4), whereas open arrows represent bands precipitated by the inactive marker antibody, MeCP2. (B) Confirmation of bands with a standard ChIP assay. Sixteen randomly chosen bands obtained from the ChAP assay were examined by using a conventional ChIP assay. Input DNA, sample representing total input chromatin (0.2%) for each experiment.
Fig. 3.
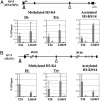
Comparison of the levels of acetylated H3 and dimethylated H3-K4 in the 5′ regions versus the body of genes HTATIP2 (A) and MAN1 (B). Results were obtained from three separate real-time PCRs of three independent ChIP assays. (A and B Upper) Solid boxes indicate exons, and arrows indicate potential transcriptional start sites. Triangles (filled triangle for 5′ region of the gene and open triangle for body of gene) indicate regions analyzed by quantitative real-time PCR. (A and B Lower) Error bars indicate the standard deviation obtained from three independent experiments.
Fig. 4.
(A) Map of the p16 gene locus spanning the region upstream of the promoter through exon 2. The arrow indicates the transcription start site. The gray boxes indicate CpG islands, and the hatched boxes indicate repetitive elements. The horizontal bars below the map indicate the location of the 10 DNA regions (≈78-112 bp in size) amplified by quantitative real-time PCR. (B) Map of histone modifications along the p16 locus (regions 1-10) immunoprecipitated with antibodies for acetylated H3-K9/14, dimethylated H3-K4, trimethylated H3-K4, respectively, in the LD419 fibroblast line, which expresses p16 (filled bars), and the T24 cancer cell line, which does not express p16 (open bars). Error bars indicate the standard deviation obtained from three to five independent experiments.
Fig. 2.
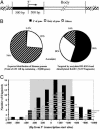
(A) Map of the 5′ region (located within 500 bp of either side of a transcriptional start site or 5′ end of an EST gene) and the body of a gene (any region 500 bp or farther downstream of the transcriptional start site in the gene). (B) Comparison of the 5′ region and body of genes in bands targeted by acetylated K9/14-H3 and dimethylated H3-K4 and the expected distribution of these regions in the whole human genome. Others, nongene regions. (C) Sizes and locations of the sequences with respect to the 5′ start sites of 38 regions immunoprecipitated by acetylated H3-K9/14 and dimethylated H3-K4 antibodies within 1 kb of the nearest the transcription start site. Each horizontal bar represents an individual band cloned and sequenced from the AP-PCR gels and positioned with respect to the start site in the GenBank database. Vertical bars represent the number of sequences in each 200-bp window at the indicated position relative to the start site. The gray box represents the region within 500 bp of either side of a transcriptional start site.
Similar articles
- Histone H3 acetylation and H3 K4 methylation define distinct chromatin regions permissive for transgene expression.
Yan C, Boyd DD. Yan C, et al. Mol Cell Biol. 2006 Sep;26(17):6357-71. doi: 10.1128/MCB.00311-06. Mol Cell Biol. 2006. PMID: 16914722 Free PMC article. - Chromatin immunoprecipitation microarrays for identification of genes silenced by histone H3 lysine 9 methylation.
Kondo Y, Shen L, Yan PS, Huang TH, Issa JP. Kondo Y, et al. Proc Natl Acad Sci U S A. 2004 May 11;101(19):7398-403. doi: 10.1073/pnas.0306641101. Epub 2004 May 3. Proc Natl Acad Sci U S A. 2004. PMID: 15123805 Free PMC article. - Differentially expressed genes are marked by histone 3 lysine 9 trimethylation in human cancer cells.
Wiencke JK, Zheng S, Morrison Z, Yeh RF. Wiencke JK, et al. Oncogene. 2008 Apr 10;27(17):2412-21. doi: 10.1038/sj.onc.1210895. Epub 2007 Oct 29. Oncogene. 2008. PMID: 17968314 - Histone acetylation: where to go and how to get there.
MacDonald VE, Howe LJ. MacDonald VE, et al. Epigenetics. 2009 Apr 1;4(3):139-43. doi: 10.4161/epi.4.3.8484. Epub 2009 Apr 18. Epigenetics. 2009. PMID: 19430203 Review. - [Exploration of the hidden layers of genome].
Cao GS, Liu AL, Li N. Cao GS, et al. Yi Chuan. 2004 Sep;26(5):714-20. Yi Chuan. 2004. PMID: 15640091 Review. Chinese.
Cited by
- Discovery and mechanism of natural products as modulators of histone acetylation.
Salvador LA, Luesch H. Salvador LA, et al. Curr Drug Targets. 2012 Jul;13(8):1029-47. doi: 10.2174/138945012802008973. Curr Drug Targets. 2012. PMID: 22594471 Free PMC article. Review. - Proportions of acetyl-histone-positive hepatocytes indicate the functional status and prognosis of cirrhotic patients.
Zhou P, Xia J, Zhou YJ, Wan J, Li L, Bao J, Shi YJ, Bu H. Zhou P, et al. World J Gastroenterol. 2015 Jun 7;21(21):6665-74. doi: 10.3748/wjg.v21.i21.6665. World J Gastroenterol. 2015. PMID: 26074705 Free PMC article. - Linking epithelial-to-mesenchymal-transition and epigenetic modifications.
Stadler SC, Allis CD. Stadler SC, et al. Semin Cancer Biol. 2012 Oct;22(5-6):404-10. doi: 10.1016/j.semcancer.2012.06.007. Epub 2012 Jun 15. Semin Cancer Biol. 2012. PMID: 22706095 Free PMC article. Review. - Constitutive nucleosome depletion and ordered factor assembly at the GRP78 promoter revealed by single molecule footprinting.
Gal-Yam EN, Jeong S, Tanay A, Egger G, Lee AS, Jones PA. Gal-Yam EN, et al. PLoS Genet. 2006 Sep 22;2(9):e160. doi: 10.1371/journal.pgen.0020160. PLoS Genet. 2006. PMID: 17002502 Free PMC article. - Characterization of cis- and trans-acting elements in the imprinted human SNURF-SNRPN locus.
Rodriguez-Jato S, Nicholls RD, Driscoll DJ, Yang TP. Rodriguez-Jato S, et al. Nucleic Acids Res. 2005 Aug 22;33(15):4740-53. doi: 10.1093/nar/gki786. Print 2005. Nucleic Acids Res. 2005. PMID: 16116039 Free PMC article.
References
- Hartzog, G. A. (2003) Curr. Opin. Genet. Dev. 13, 119-126. - PubMed
- Kurdistani, S. K. & Grunstein, M. (2003) Nat. Rev. Mol. Cell Biol. 4, 276-284. - PubMed
- Gerber, M. & Shilatifard, A. (2003) J. Biol. Chem. 278, 26303-26306. - PubMed
- Pokholok, D. K., Hannett, N. M. & Young, R. A. (2002) Mol. Cell 9, 799-809. - PubMed
Publication types
MeSH terms
Substances
Grants and funding
- 82422/PHS HHS/United States
- T32 CA009659/CA/NCI NIH HHS/United States
- R01 CA082422/CA/NCI NIH HHS/United States
- R37 CA082422/CA/NCI NIH HHS/United States
- T32 CA 09659/CA/NCI NIH HHS/United States
LinkOut - more resources
Full Text Sources
Other Literature Sources


