Imaging single membrane fusion events mediated by SNARE proteins - PubMed (original) (raw)
Imaging single membrane fusion events mediated by SNARE proteins
Marina Fix et al. Proc Natl Acad Sci U S A. 2004.
Abstract
Using total internal reflection fluorescence microscopy, we have developed an assay to monitor individual fusion events between proteoliposomes containing vesicle soluble N-ethylmaleimide-sensitive factor attachment protein receptors (SNAREs) and a supported planar bilayer containing cognate target SNAREs. Approach, docking, and fusion of individual vesicles to the target membrane were quantified by delivery and subsequent lateral spread of fluorescent phospholipids from the vesicle membrane into the target bilayer. Fusion probability was increased by raising divalent cations (Ca2+ and Mg2+). Fusion of individual vesicles initiated in <100 ms after the rise of Ca2+ and membrane mixing was complete in 300 ms. Removal of the N-terminal H(abc) domain of syntaxin 1A increased fusion probability >30-fold compared to the full-length protein, but even in the absence of the H(abc) domain, vesicle fusion was still enhanced in response to Ca2+ increase. Our observations establish that the SNARE core complex is sufficient to fuse two opposing membrane bilayers at a speed commensurate with most membrane fusion processes in cells. This real-time analysis of single vesicle fusion opens the door to mechanistic studies of how SNARE and accessory proteins regulate fusion processes in vivo.
Figures
Fig. 1.
Reconstituted membrane fusion by trans SNARE complexes revealed by single vesicle TIR-FM. (A) v-liposome is docked to a t-SNARE bilayer supported on glass. (B) v-liposome, which appears at the target membrane, stays, then disappears again, leaving no fluorescence at the target membrane. (C) Two v-liposomes are docked to the target membrane; one (marked by asterisk) fuses with the target membrane. The pseudocolored plots in A-C show in the z direction the fluorescence intensity [0-100 arbitrary units (au) in 20-au steps from dark blue to orange] of each pixel in the image field depicted below in gray scale (21 × 21 pixels, 21 pixels = 2.3 μm). The pixel intensity for the background was subtracted from raw data. (D-F) The lateral spread of fluorescence indicates fusion. The events in _A_-C are shown as average pixel intensity for pixels up to approximately six pixels in each direction from the origin (pixel with maximal intensity).
Fig. 2.
Peak and total intensity courses (blue and black lines, respectively) over time for a fluorescently tagged liposome using TIR-FM that approaches the supported membrane bilayer, then docks and retreats (A); undergoes exchange of fluorophores from the outer leaflet to the upper leaflet of the supported membrane, which then diffuse away (B); and approaches the target membrane, docks, and then fuses (C). SNARE-mediated fusion of the two opposing membrane bilayers can be monitored by delivery and subsequent lateral spread of fluorescence in the supported target membrane (adapted from ref. 6).
Fig. 3.
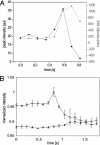
(A) Quantified peak fluorescence (black) and total fluorescence intensity (gray) for a fusion event. (B) Normalized peak intensity for n = 3 fusing vesicles (open symbols) over time in comparison with background fluorescence (filled symbols). Means ± SEM.
Fig. 4.
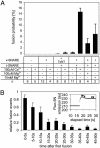
(A) SNARE motifs in trans complexes are essential for membrane fusion. Shown is the number of fusing v-liposomes as percentage of all v-liposomes at the target membrane within the first 50 s of video streaming before addition of divalent cations or within 50 s after the addition of divalent cations. Error values represent SEM. (B) More than 50% of fusion-competent v-liposomes fuse within 10 s after Ca2+ addition. The bars represent means ± SEM of normalized values for eight independent experiments (total of 696 fusion events); the final Ca2+ concentration was 100 μM. (B Inset) The onset of Ca2+-evoked fusion is fast. Using dual-color TIR-FM, the emission of Fluo-5N and Rh-DPPE-labeled v-liposomes was recorded simultaneously. Ca2+ was added after recording times >10 s to establish baseline behavior. The plot shown is representative of four experiments. The final Ca2+ concentration used was 200 μM.
Fig. 5.
The N-terminal Habc domain of syntaxin acts as an inhibitor of fusion. (A) Fusion probability of v-liposomes to target membranes containing full-length syntaxin 1A and syntaxin without the N-terminal Habc domain. Fusion probability represents the number of fusing v-liposomes as percentage of all docked v-liposomes within 50 s of video streaming or within 50 s after the addition of divalent cations. (B and C) Circles mark fusion events within 5 s before the frame shown, except (C Right) where fusions for the first 2 s of a 5-s span are circled. (D) Time spent by individual v-liposomes at the target membrane before Ca2+-independent fusion is variable (total of 192 fusion events and four independent experiments).
Similar articles
- The t-SNARE syntaxin is sufficient for spontaneous fusion of synaptic vesicles to planar membranes.
Woodbury DJ, Rognlien K. Woodbury DJ, et al. Cell Biol Int. 2000;24(11):809-18. doi: 10.1006/cbir.2000.0631. Cell Biol Int. 2000. PMID: 11067766 - Topological restriction of SNARE-dependent membrane fusion.
Parlati F, McNew JA, Fukuda R, Miller R, Söllner TH, Rothman JE. Parlati F, et al. Nature. 2000 Sep 14;407(6801):194-8. doi: 10.1038/35025076. Nature. 2000. PMID: 11001058 - Vesicular restriction of synaptobrevin suggests a role for calcium in membrane fusion.
Hu K, Carroll J, Fedorovich S, Rickman C, Sukhodub A, Davletov B. Hu K, et al. Nature. 2002 Feb 7;415(6872):646-50. doi: 10.1038/415646a. Nature. 2002. PMID: 11832947 - Membrane fusion: all done with SNAREpins?
Edwardson JM. Edwardson JM. Curr Biol. 1998 May 21;8(11):R390-3. doi: 10.1016/s0960-9822(98)70245-3. Curr Biol. 1998. PMID: 9635186 Review. - SNAREs and SNARE regulators in membrane fusion and exocytosis.
Gerst JE. Gerst JE. Cell Mol Life Sci. 1999 May;55(5):707-34. doi: 10.1007/s000180050328. Cell Mol Life Sci. 1999. PMID: 10379359 Free PMC article. Review.
Cited by
- Dynamic Fusion of Nucleic Acid Functionalized Nano-/Micro-Cell-Like Containments: From Basic Concepts to Applications.
Li Z, Wang J, O'Hagan MP, Huang F, Xia F, Willner I. Li Z, et al. ACS Nano. 2023 Aug 22;17(16):15308-15327. doi: 10.1021/acsnano.3c04415. Epub 2023 Aug 7. ACS Nano. 2023. PMID: 37549398 Free PMC article. Review. - Postsynaptic VAMP/Synaptobrevin Facilitates Differential Vesicle Trafficking of GluA1 and GluA2 AMPA Receptor Subunits.
Hussain S, Davanger S. Hussain S, et al. PLoS One. 2015 Oct 21;10(10):e0140868. doi: 10.1371/journal.pone.0140868. eCollection 2015. PLoS One. 2015. PMID: 26488171 Free PMC article. - SNARE requirements en route to exocytosis: from many to few.
Mohrmann R, Sørensen JB. Mohrmann R, et al. J Mol Neurosci. 2012 Oct;48(2):387-94. doi: 10.1007/s12031-012-9744-2. Epub 2012 Mar 17. J Mol Neurosci. 2012. PMID: 22427188 Review. - Anionic lipids are required for vesicular stomatitis virus G protein-mediated single particle fusion with supported lipid bilayers.
Matos PM, Marin M, Ahn B, Lam W, Santos NC, Melikyan GB. Matos PM, et al. J Biol Chem. 2013 May 3;288(18):12416-25. doi: 10.1074/jbc.M113.462028. Epub 2013 Mar 14. J Biol Chem. 2013. PMID: 23493401 Free PMC article. - Discrimination between docking and fusion of liposomes reconstituted with neuronal SNARE-proteins using FCS.
Cypionka A, Stein A, Hernandez JM, Hippchen H, Jahn R, Walla PJ. Cypionka A, et al. Proc Natl Acad Sci U S A. 2009 Nov 3;106(44):18575-80. doi: 10.1073/pnas.0906677106. Epub 2009 Oct 20. Proc Natl Acad Sci U S A. 2009. PMID: 19843696 Free PMC article.
References
- Söllner, T. H. (2003) Mol. Membr. Biol. 20, 209-220. - PubMed
- Ungar, D. & Hughson, F. M. (2003) Annu. Rev. Cell Dev. Biol. 19, 493-517. - PubMed
- Hu, C., Ahmed, M., Melia, T. J., Söllner, T. H., Mayer, T. & Rothman, J. E. (2003) Science 300, 1745-1749. - PubMed
- Weber, T., Zemelman, B. V., McNew, J. A., Westermann, B., Gmachl, M., Parlati, F., Söllner, T. H. & Rothman, J. E. (1998) Cell 92, 759-772. - PubMed
- Oheim, M., Loerke, D., Stühmer, W. & Chow, R. H. (1998) Eur. Biophys. J. 27, 83-98. - PubMed
Publication types
MeSH terms
Substances
Grants and funding
- R01 DK027044/DK/NIDDK NIH HHS/United States
- R01 NS043391/NS/NINDS NIH HHS/United States
- F32 GM069200/GM/NIGMS NIH HHS/United States
- 1F32 GM 069200/GM/NIGMS NIH HHS/United States
- R01 DK 27044/DK/NIDDK NIH HHS/United States
- R91 NS 043391/NS/NINDS NIH HHS/United States
LinkOut - more resources
Full Text Sources
Other Literature Sources
Miscellaneous


