Simultaneous stretching and contraction of stress fibers in vivo - PubMed (original) (raw)
Simultaneous stretching and contraction of stress fibers in vivo
Lynda J Peterson et al. Mol Biol Cell. 2004 Jul.
Abstract
To study the dynamics of stress fiber components in cultured fibroblasts, we expressed alpha-actinin and the myosin II regulatory myosin light chain (MLC) as fusion proteins with green fluorescent protein. Myosin activation was stimulated by treatment with calyculin A, a serine/threonine phosphatase inhibitor that elevates MLC phosphorylation, or with LPA, another agent that ultimately stimulates phosphorylation of MLC via a RhoA-mediated pathway. The resulting contraction caused stress fiber shortening and allowed observation of changes in the spacing of stress fiber components. We have observed that stress fibers, unlike muscle myofibrils, do not contract uniformly along their lengths. Although peripheral regions shortened, more central regions stretched. We detected higher levels of MLC and phosphorylated MLC in the peripheral region of stress fibers. Fluorescence recovery after photobleaching revealed more rapid exchange of myosin and alpha-actinin in the middle of stress fibers, compared with the periphery. Surprisingly, the widths of the myosin and alpha-actinin bands in stress fibers also varied in different regions. In the periphery, the banding patterns for both proteins were shorter, whereas in central regions, where stretching occurred, the bands were wider.
Figures
Figure 1.
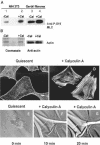
Calyculin A, 5 nM, treatment induces stress fiber formation and increased wrinkling of flexible rubber substrates in serum-starved, quiescent Swiss 3T3 fibroblasts. (A) NIH 3T3 fibroblasts (lanes 1 and 2) or gerbil fibroma cells (lanes 3 and 4) were treated with vehicle alone (lanes 1 and 3) or with calyculin A (lanes 2 and 4) and show increased phosphorylation on Ser19 of MLCs by immunoblotting of whole cell lystaes with an antibody specific for P-Ser19 on MLC. (B) After immunoblotting with the phosphospecific antibody, membranes were stripped and either stained with Coomassie blue or reprobed with antiactin antibody to confirm equal protein loading. (C) Quiescent cells have lost stress fibers as shown by fluorescent labeling with FITC-conjugated phalloidin. (D) Ten mintes after addition of calyculin A, stress fibers have reformed. (E-G) Time series images of a single cell shown before stimulation (E), and at 10 (F) and 20 min (G) after stimulation with 5 nM calyculin, which induces wrinkling in the rubber substrate underlying the cell. Bar, 10 μm.
Figure 2.
Stimulation of contractility changes stress fibers and focal adhesions. (A-D) Time-lapse images of Swiss 3T3 cells expressing GFP-α-actinin captured at 0 min, and at 10, 15, and 20 min after addition of 5 nM calyculin A show that GFP-α-actinin bands along stress fibers move closer together (arrows). Contraction of stress fibers and centripetal movement of focal adhesions (marked by asterisks, *) can also be observed in movement of both structures from left (cell periphery) to right (toward cell center) in successive time-lapse images. Bar, 2 μm.
Figure 3.
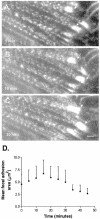
Focal adhesion area increases in response to increased contraction. (A-C) Time-lapse image series showing growth of focal adhesions marked by GFP-α-actinin expressed in Swiss 3T3 cells treated with 5 nM calyculin A. (D) Graph of focal adhesion area following stimulation with 5 nM calyculin.
Figure 4.
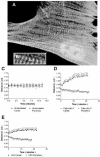
Simultaneous stretching and shortening of α-actinin periodicity in contracting stress fibers. (A) Well-spread Swiss 3T3 cell maintained in serum showing GFP-α-actinin distribution before stimulation. (B) Enlarged area from (A) illustrating sarcomeric unit of stress fibers and center-to-center spacing used to measure “sarcomere” length. (C-E) Measurements of sarcomere length over time showed no change in unstimulated cells (C), but revealed simultaneous stretching and shortening of sarcomeres in cells stimulated with 5 nM calyculin A (D) or LPA (E).
Figure 5.
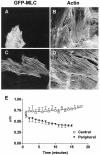
GFP-MLC expressed in NIH 3T3 fibroblasts or gerbil fibroma cells incorporates into stress fibers. (A) NIH 3T3 or (C) gerbil fibroma cells were transiently transfected with GFP-MLC and double-labeled with fluorescently tagged phalloidin to show filamentous actin (B and D). (E) Center-to-center spacing (periodicity) of GFP-MLC in NIH 3T3 cells decreased in the periphery of stress fibers after stimulation of contractility, whereas the periodicity in the central regions increased.
Figure 6.
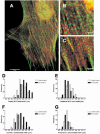
Indirect immunofluorescence of myosin light chains (red) and α-actinin (green) shows complementary periodic localization along stress fibers. (A) Stress fiber banding patterns are visible in a gerbil fibroma cell, 5 min after stimulation with 5 nM calyculin. (B) α-actinin and MLC bands are wider in central regions than in peripheral regions (C). (D) Bandwidths of MLC in central regions increase after stimulation with calyculin A shown by a shift in frequency distribution of band-widths. (E) MLC bandwidths at the periphery display a decrease as shown by a shift of the frequency distribution in the opposite direction. (F) α-actinin bandwidths in central regions are increased after stimulation, whereas those at the periphery decrease (G). Bars, 10 μm (A) and 5 μm (B).
Figure 7.
Fluorescence intensity of antibody-labeled MLC and α-actinin measured in the central and peripheral regions of stress fibers of extracted cells that have been treated with 5 nM calyculin A. (A) Gerbil fibroma cells have higher fluorescence intensity per μm2 and therefore a greater concentration of MLC at the periphery. (B) Fluorescence intensity and concentration of α-actinin is greater in central stress fiber regions. Line scans of fluorescence intensities along stress fiber segments show differences in intensities and periodicities of antibody-labeled MLC and α-actinin between the center and the periphery after calyculin A stimulation. Multiple line scans were aligned as described in the text for MLC (C) or α-actinin (D). MLC is less concentrated and has longer periodicities in central regions than in peripheral regions (C). (D) The average central periodicity between α-actinin peaks is greater than that in the periphery. Fluorescence intensities display the reverse relationship to that found for MLC. Higher α-actinin fluorescence occurs in central regions than in peripheral regions.
Figure 8.
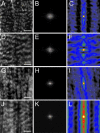
Autocorrelation and Fourier analyses of fluorescence bands of α-actinin and MLC in gerbil fibroma cells 5 min after stimulation with 5 nM calyculin A. Sample images of α-actinin at the periphery (A) and center (D), with their respective power spectra (B and E) and autocorrelation images (C and F). Sample images of MLC at the periphery (G) and center (J), with their respective power spectra (H and K) and autocorrelation images (I and L). The red dots in panels B, E, H, and K represent the location of the computer-measured peaks within the power spectra. Scale bars, 2 μm.
Figure 9.
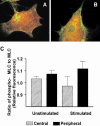
Distribution of phosphorylated MLC in unstimulated and stimulated gerbil fibroma cells. (A and B) Indirect immunolabelling of fibroma cells with antibodies specific for MLC (red) and phospho-Ser19-MLC (green). Green reveals higher concentrations of phospho-MLC at the periphery of stress fibers in both unstimulated (A) and stimulated cells (B). The ratio of phospho-MLC to MLC increases after stimulation (C).
Figure 10.
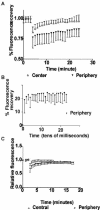
FRAP of GFP-MLC (expressed in gerbil fibroma cells) or GFP-α-actinin (expressed in Swiss 3T3 fibroblasts). (A) Greater exchange of GFP-MLC occurs in central regions than in peripheral zones. The _t_1/2 of GFP-MLC in central regions is 8.5 min (n = 14), whereas that for peripheral spots is _t_1/2 > 21 min after photobleaching (N = 9). (B) Fast phase of fluorescence recovery due to passive diffusion of GFP-MLC shows ∼21% recovery of prebleach fluorescence within the first 10 msec after bleaching before plateauing before beginning the slow phase of active recovery depicted in A. (C) GFP-α-actinin recovers after photobleaching with a _t_1/2 = 2.5 min in central regions and 4 min in peripheral regions with essentially full recovery by 8-10 min in both regions.
Similar articles
- Regulation of myosin II dynamics by phosphorylation and dephosphorylation of its light chain in epithelial cells.
Watanabe T, Hosoya H, Yonemura S. Watanabe T, et al. Mol Biol Cell. 2007 Feb;18(2):605-16. doi: 10.1091/mbc.e06-07-0590. Epub 2006 Dec 6. Mol Biol Cell. 2007. PMID: 17151359 Free PMC article. - Rho-kinase dependent organization of stress fibers and focal adhesions in cultured fibroblasts.
Katoh K, Kano Y, Ookawara S. Katoh K, et al. Genes Cells. 2007 May;12(5):623-38. doi: 10.1111/j.1365-2443.2007.01073.x. Genes Cells. 2007. PMID: 17535253 - Diphosphorylation of the myosin regulatory light chain enhances the tension acting on stress fibers in fibroblasts.
Mizutani T, Haga H, Koyama Y, Takahashi M, Kawabata K. Mizutani T, et al. J Cell Physiol. 2006 Dec;209(3):726-31. doi: 10.1002/jcp.20773. J Cell Physiol. 2006. PMID: 16924661 - Rac-induced increase of phosphorylation of myosin regulatory light chain in HeLa cells.
Brzeska H, Szczepanowska J, Matsumura F, Korn ED. Brzeska H, et al. Cell Motil Cytoskeleton. 2004 Jul;58(3):186-99. doi: 10.1002/cm.20009. Cell Motil Cytoskeleton. 2004. PMID: 15146537 - Regulation of myosin II during cytokinesis in higher eukaryotes.
Matsumura F. Matsumura F. Trends Cell Biol. 2005 Jul;15(7):371-7. doi: 10.1016/j.tcb.2005.05.004. Trends Cell Biol. 2005. PMID: 15935670 Review.
Cited by
- Nuclear plasticity increases susceptibility to damage during confined migration.
Mukherjee A, Barai A, Singh RK, Yan W, Sen S. Mukherjee A, et al. PLoS Comput Biol. 2020 Oct 9;16(10):e1008300. doi: 10.1371/journal.pcbi.1008300. eCollection 2020 Oct. PLoS Comput Biol. 2020. PMID: 33035221 Free PMC article. - Piezo1 activation attenuates thrombin-induced blebbing in breast cancer cells.
O'Callaghan P, Engberg A, Eriksson O, Fatsis-Kavalopoulos N, Stelzl C, Sanchez G, Idevall-Hagren O, Kreuger J. O'Callaghan P, et al. J Cell Sci. 2022 Apr 1;135(7):jcs258809. doi: 10.1242/jcs.258809. Epub 2022 Apr 1. J Cell Sci. 2022. PMID: 35274124 Free PMC article. - Focal adhesion size controls tension-dependent recruitment of alpha-smooth muscle actin to stress fibers.
Goffin JM, Pittet P, Csucs G, Lussi JW, Meister JJ, Hinz B. Goffin JM, et al. J Cell Biol. 2006 Jan 16;172(2):259-68. doi: 10.1083/jcb.200506179. Epub 2006 Jan 9. J Cell Biol. 2006. PMID: 16401722 Free PMC article. - LIMCH1 regulates nonmuscle myosin-II activity and suppresses cell migration.
Lin YH, Zhen YY, Chien KY, Lee IC, Lin WC, Chen MY, Pai LM. Lin YH, et al. Mol Biol Cell. 2017 Apr 15;28(8):1054-1065. doi: 10.1091/mbc.E15-04-0218. Epub 2017 Feb 22. Mol Biol Cell. 2017. PMID: 28228547 Free PMC article. - A multi-modular tensegrity model of an actin stress fiber.
Luo Y, Xu X, Lele T, Kumar S, Ingber DE. Luo Y, et al. J Biomech. 2008 Aug 7;41(11):2379-87. doi: 10.1016/j.jbiomech.2008.05.026. Epub 2008 Jul 15. J Biomech. 2008. PMID: 18632107 Free PMC article.
References
- Banker, B.Q. and Engel, A.G. (1994). Basic reactions of muscle. In: Myology, vol. 1, 2nd ed., ed. A.G. Engel and C. Franzini-Armstrong, New York: McGraw-Hill, 832-848.
- Burridge, K. (1981). Are stress fibres contractile? Nature 294, 691-692. - PubMed
- Burridge, K., and Feramisco, J.R. (1981). Nonmuscle α-actinins: calcium-sensitive actin-binding proteins. Nature 294, 565-567. - PubMed
- Burridge, K., Fath, K., Kelly, K., Nuckolls, G., and Turner, C. (1988). Focal adhesions: transmembrane junctions between the extracellular matrix and cytoskeleton. Annu. Rev. Cell Biol. 4, 487-525. - PubMed
- Byers, H.R., White, G.E., and Fujiwara, K. (1984). Organization and function of stress fibers in cells in vitro and in situ. Cell Muscle Motil. 5, 83-137. - PubMed
Publication types
MeSH terms
Substances
Grants and funding
- GM-29860/GM/NIGMS NIH HHS/United States
- HL-45100/HL/NHLBI NIH HHS/United States
- R01 GM061743/GM/NIGMS NIH HHS/United States
- U54 GM064346/GM/NIGMS NIH HHS/United States
- GM-64346/GM/NIGMS NIH HHS/United States
- R01 GM029860/GM/NIGMS NIH HHS/United States
- GM-61743/GM/NIGMS NIH HHS/United States
- P01 HL045100/HL/NHLBI NIH HHS/United States
LinkOut - more resources
Full Text Sources
Miscellaneous
