Nonclassical CD1d-restricted NK T cells that produce IL-13 characterize an atypical Th2 response in ulcerative colitis - PubMed (original) (raw)
. 2004 May;113(10):1490-7.
doi: 10.1172/JCI19836.
Frank Heller, Monica Boirivant, Francisco Leon, Masaru Yoshida, Stefan Fichtner-Feigl, Zhiqiong Yang, Mark Exley, Atsushi Kitani, Richard S Blumberg, Peter Mannon, Warren Strober
Affiliations
- PMID: 15146247
- PMCID: PMC406524
- DOI: 10.1172/JCI19836
Nonclassical CD1d-restricted NK T cells that produce IL-13 characterize an atypical Th2 response in ulcerative colitis
Ivan J Fuss et al. J Clin Invest. 2004 May.
Abstract
While Crohn disease (CD) has been clearly identified as a Th1 inflammation, the immunopathogenesis of its counterpart inflammatory bowel disease, ulcerative colitis (UC), remains enigmatic. Here we show that lamina propria T (LPT) cells from UC patients produce significantly greater amounts of IL-13 (and IL-5) than control cells and little IFN-gamma, whereas comparable cells from CD patients produce large amounts of IFN-gamma and small amounts of IL-13. We then show that stimulation of UC LPT cells bearing an NK marker (CD161) with anti-CD2/anti-CD28 or with B cells expressing transfected CD1d induces substantial IL-13 production. While this provided firm evidence that the IL-13-producing cell is an NK T (NKT) cell, it became clear that this cell does not express invariant NKT cell receptors characteristic of most NKT cells since there was no increase in cells binding alpha-galactosylceramide-loaded tetramers, and alpha-galactosylceramide did not induce IL-13 secretion. Finally, we show that both human NKT cell lines as well as UC CD161(+) LPT cells are cytotoxic for HT-29 epithelial cells and that this cytotoxicity is augmented by IL-13. These studies show that UC is associated with an atypical Th2 response mediated by nonclassical NKT cells producing IL-13 and having cytotoxic potential for epithelial cells.
Figures
Figure 1
Cytokine secretion by control, CD, and UC LPMCs. (A) IL-13, (B) IFN-γ, (C) IL-5, and (D) IL-4 secretion by LPMCs obtained from control (n = 6), involved CD (n = 8), and involved UC (n = 12) tissues induced by anti-CD2/anti-CD28. In all experiments error bars represent SEMs. Similar secretion patterns for all cytokine analyzed were found with anti-CD3/anti-CD28 stimulation of LPMCs.
Figure 2
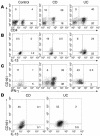
Intracellular cytokine expression of CD161+ LPMC. (A) CD161 expression on unstimulated CD3+ LPMCs. LPMCs from control (n = 5), involved CD (n = 6), and involved UC (n = 8) tissues were stained with fluorochrome-labeled Ab’s recognizing various surface antigens (CyChrome-labeled anti-CD3, PE-labeled anti-CD4, and FITC-labeled anti-CD161) and then were analyzed for the expression of CD4+ versus CD161+ cells on CD3-gated cells. (B) Intracellular IL-13 cytokine production by stimulated LPMCs. LPMCs from control (n = 5), involved CD (n = 6), and involved UC (n = 8) tissues were cultured for 48 hours with anti-CD2/anti-CD28 with addition of monensin for the last 6 hours of culture. The resultant cells were stained with fluorochrome-labeled Ab’s recognizing various surface antigens (CyChrome-labeled anti-CD3, APC-labeled anti-CD8, and FITC-labeled anti-CD161) and then were fixed/permeabilized prior to intracellular cytokine staining with PE-labeled anti_IL-13. Cells were gated on CD3 and analyzed for the expression of CD8_ (CD4+) cells and CD161+ cells versus IL-13+ cells. (C) Intracellular IFN-γ cytokine production by stimulated LPMCs was the same as in B, except LPMCs were cultured for 6 hours with PMA and ionomycin with the addition of monensin for the last 5 hours of culture, and fixed/permeabilized cells were stained with APC-labeled anti_IFN-γ. (D) Intracellular IL-13 cytokine production by unstimulated LPMCs. LPMCs from involved CD (n = 4) and involved UC (n = 4) tissues were stained with fluorochrome-labeled Ab’s recognizing various surface antigens (CyChrome-labeled anti-CD3, APC-labeled anti-CD8, and FITC-labeled anti-CD161) and then fixed/permeabilized prior to intracellular cytokine staining with PE-labeled anti_IL-13. Cells were gated on CD3 and analyzed for the expression of CD4+ cells and CD161+ cells versus IL-13+ cells.
Figure 3
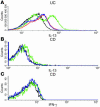
Stimulation of cytokine production in LPMCs by EBV-transformed B cells expressing surface CD1d. (A) LPMCs isolated from involved UC lamina propria were cultured for 48 hours with PMA/IL-2 (black line) (see Methods) in the presence or absence of EBV-transformed B cells transfected with CD1d (721 cells) (green line) with or without anti-CD1d mAb (51.1.3) (red line) or untransfected 721 (WT) B cells (blue line). (B and C) LPMCs isolated from involved CD lamina propria were treated as in A. In all cultures monensin was added 6 hours prior to cell harvest. Cells were initially surface stained with fluorochrome-labeled Ab’s (CyChrome-labeled anti-CD3 and APC- or PE-labeled anti-CD8) and then fixed/permeabilized prior to intracellular staining with PE-labeled anti_IL-13 or APC-labeled anti_IFN-γ. CD3-gated cells were then analyzed for CD4+ versus IL-13+ or IFN-γ cells. Histogram shown is representative of three for each patient population.
Figure 4
IL-13 secretion of UC LPMCs stimulated with EBV-transformed B cells transfected with CD1d. LPMCs extracted from involved UC tissue were cultured for 48 hours with PMA/IL-2 (see Methods) in the presence or absence of EBV-transformed B cells transfected with CD1d (721 cells) or untransfected 721 WT cells in the presence and absence of anti-CD1d mAb (51.1.3). Culture supernatants were assayed by ELISA for the secretion of IL-13. Error bars represent SEMs.
Figure 5
Expression of invariant chain TCR in LPMC CD3+ subpopulations. (A) LPMCs isolated from control, involved CD and UC tissues, as well as a control NKT cell line (see Methods), were stained with various fluorochrome-labeled Ab’s (CyChrome-labeled anti-CD3, FITC-labeled anti-Vα24, and PE-labeled anti-Vβ11). The resultant cells were gated on CD3 and analyzed for the expression of Vα24 versus Vβ11. (B) LPMCs isolated from control, involved CD and UC tissues, as well as a control NKT cell line, were stained with FITC-labeled anti-CD3 and PE-labeled α-GalCer_loaded CD1d tetramer. The resultant cells were then analyzed for surface expression of CD3 versus α-GalCer_loaded tetramer. The dot plots in both A and B are representative of results from three experiments.
Figure 6
Cytotoxicity of NKT cells. In these studies HT-29 epithelial cells were prestimulated with LPS (see Methods) to induce increased expression of CD1d (data not shown). (A) Invariant NKT cells were cultured with target HT-29 cells in the presence or absence of IL-13 Ab (see Methods), and the percentage of cytotoxicity was measured by the CytoTox 96 System (n = 4 experiments). Error bars represent SEMs. (B) Purified UC lamina propria (LP) CD4+CD161+T cells were cultured as in A. (C) Purified CD LP CD4+CD161+ T cells were cultured as in A. For both B and C, n = 2 experiments. Error bars represent SDs.
Comment in
- Natural killer T cells: dogs of war or defenders of peace?
Faubion WA Jr. Faubion WA Jr. Inflamm Bowel Dis. 2005 Jan;11(1):74-5. doi: 10.1097/00054725-200501000-00011. Inflamm Bowel Dis. 2005. PMID: 15674117 No abstract available.
Similar articles
- Human NKT cells mediate antitumor cytotoxicity directly by recognizing target cell CD1d with bound ligand or indirectly by producing IL-2 to activate NK cells.
Metelitsa LS, Naidenko OV, Kant A, Wu HW, Loza MJ, Perussia B, Kronenberg M, Seeger RC. Metelitsa LS, et al. J Immunol. 2001 Sep 15;167(6):3114-22. doi: 10.4049/jimmunol.167.6.3114. J Immunol. 2001. PMID: 11544296 - Cutting edge: Compartmentalization of Th1-like noninvariant CD1d-reactive T cells in hepatitis C virus-infected liver.
Exley MA, He Q, Cheng O, Wang RJ, Cheney CP, Balk SP, Koziel MJ. Exley MA, et al. J Immunol. 2002 Feb 15;168(4):1519-23. doi: 10.4049/jimmunol.168.4.1519. J Immunol. 2002. PMID: 11823474 - Hepatic CD1d expression in hepatitis C virus infection and recognition by resident proinflammatory CD1d-reactive T cells.
Durante-Mangoni E, Wang R, Shaulov A, He Q, Nasser I, Afdhal N, Koziel MJ, Exley MA. Durante-Mangoni E, et al. J Immunol. 2004 Aug 1;173(3):2159-66. doi: 10.4049/jimmunol.173.3.2159. J Immunol. 2004. PMID: 15265953 - Invariant NKT and NKT-like lymphocytes: two different T cell subsets that are differentially affected by ageing.
Peralbo E, Alonso C, Solana R. Peralbo E, et al. Exp Gerontol. 2007 Aug;42(8):703-8. doi: 10.1016/j.exger.2007.05.002. Epub 2007 May 21. Exp Gerontol. 2007. PMID: 17604928 Review.
Cited by
- Therapeutic role of extracellular vesicles from human umbilical cord mesenchymal stem cells and their wide therapeutic implications in inflammatory bowel disease and other inflammatory disorder.
Din MAU, Wan A, Chu Y, Zhou J, Yan Y, Xu Z. Din MAU, et al. Front Med (Lausanne). 2024 Jul 30;11:1406547. doi: 10.3389/fmed.2024.1406547. eCollection 2024. Front Med (Lausanne). 2024. PMID: 39139783 Free PMC article. Review. - A Case of Eosinophilic Gastroenteritis Remission Achieved Steroid-Free With Mepolizumab.
Hirata Y, Nakamura T, Higuchi K. Hirata Y, et al. Gastro Hep Adv. 2022 May 3;1(4):553-554. doi: 10.1016/j.gastha.2022.03.003. eCollection 2022. Gastro Hep Adv. 2022. PMID: 39132061 Free PMC article. - Mouse adaptation of human inflammatory bowel diseases microbiota enhances colonization efficiency and alters microbiome aggressiveness depending on the recipient colonic inflammatory environment.
Gray SM, Moss AD, Herzog JW, Kashiwagi S, Liu B, Young JB, Sun S, Bhatt AP, Fodor AA, Balfour Sartor R. Gray SM, et al. Microbiome. 2024 Aug 7;12(1):147. doi: 10.1186/s40168-024-01857-2. Microbiome. 2024. PMID: 39113097 Free PMC article. - Maximizing Treatment Options for IBD through Drug Repurposing.
Barjasteh AH, Al-Asady AM, Latifi H, Al Okla S, Al-Nazwani N, Avan A, Khazaei M, Ryzhikov M, Nadi-Yazdi H, Hassanian SM. Barjasteh AH, et al. Curr Pharm Des. 2024;30(32):2538-2549. doi: 10.2174/0113816128318032240702045822. Curr Pharm Des. 2024. PMID: 39039672 Review. - Efficacy of Laurus nobilis L. for Tight Junction Protein Imbalance in Leaky Gut Syndrome.
Shin Y, Kim J, Song Y, Kim S, Kong H. Shin Y, et al. Nutrients. 2024 Apr 23;16(9):1250. doi: 10.3390/nu16091250. Nutrients. 2024. PMID: 38732497 Free PMC article.
References
- Sartor RB. Current concepts of the etiology and pathogenesis of ulcerative colitis and Crohn’s disease. Gastroenterol. Clin. North Am. 1995;24:475–507. - PubMed
- Strober W, Fuss IJ, Blumberg RS. The immunology of mucosal models of inflammation. Annu. Rev. Immunol. 2002;20:495–549. - PubMed
- Podolsky DK. Inflammatory bowel disease. N. Engl. J. Med. 2002;347:417–429. - PubMed
Publication types
MeSH terms
Substances
Grants and funding
- R37 DK044319/DK/NIDDK NIH HHS/United States
- DK-51362/DK/NIDDK NIH HHS/United States
- DK-53056/DK/NIDDK NIH HHS/United States
- R01 DK044319/DK/NIDDK NIH HHS/United States
- DK-44319/DK/NIDDK NIH HHS/United States
LinkOut - more resources
Full Text Sources
Other Literature Sources
Medical


