Genome coverage and sequence fidelity of phi29 polymerase-based multiple strand displacement whole genome amplification - PubMed (original) (raw)
Comparative Study
doi: 10.1093/nar/gnh069.
Ming Lin, Rameen Beroukhim, Jeffrey C Lee, Xiaojun Zhao, Daniel J Richter, Stacey Gabriel, Paula Herman, Hidefumi Sasaki, David Altshuler, Cheng Li, Matthew Meyerson, William R Sellers
Affiliations
- PMID: 15150323
- PMCID: PMC419624
- DOI: 10.1093/nar/gnh069
Comparative Study
Genome coverage and sequence fidelity of phi29 polymerase-based multiple strand displacement whole genome amplification
J Guillermo Paez et al. Nucleic Acids Res. 2004.
Abstract
Major efforts are underway to systematically define the somatic and germline genetic variations causally associated with disease. Genome-wide genetic analysis of actual clinical samples is, however, limited by the paucity of genomic DNA available. Here we have tested the fidelity and genome representation of phi29 polymerase-based genome amplification (phi29MDA) using direct sequencing and high density oligonucleotide arrays probing >10,000 SNP alleles. Genome representation was comprehensive and estimated to be 99.82% complete, although six regions encompassing a maximum of 5.62 Mb failed to amplify. There was no degradation in the accuracy of SNP genotyping and, in direct sequencing experiments sampling 500,000 bp, the estimated error rate (9.5 x 10(-6)) was the same as in paired unamplified samples. The detection of cancer-associated loss of heterozygosity and copy number changes, including homozygous deletion and gene amplification, were similarly robust. These results suggest that phi29MDA yields high fidelity, near-complete genome representation suitable for high resolution genetic analysis.
Figures
Figure 1
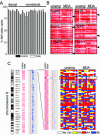
Genome coverage following whole genome amplification. (A) The SNP call rate before and after whole genome amplification. Probes were prepared from 250 ng DNA from samples of breast cancer cell line or paired normal cell line DNA either before (unamplified) or after (φ29MDA) amplification and hybridized to Affymetrix 10K SNP arrays. In addition, 14 samples were amplified without denaturation prior to whole genome amplification, while five samples were amplified after denaturation (as indicated). (B) Regions with loss of representation after φ29MDA. For each indicated region, the specific SNP allele hybridization intensity normalized on a scale of 0 (absent and white) to 6 (red) is shown for unamplified or amplified samples. Each row represents a single SNP allele, while each column represents a single DNA sample. Columns 1–5 correspond to denatured DNA samples (HCC1007BL, HCC1007, HCC1143BL, HCC1143 and HCC1599BL). (C) The absence of amplification of a region in the chromosome cytoband 6p25.3. Using dChip-Signal, the mean signal intensity for each SNP allele on the 10K array was compared between samples before (left) and after (right) whole genome amplification. Signal intensity is shown normalized on a scale of 0 (white) to 6 (red). An enlargement of this region is shown in the middle panel. The right panel indicates the calls for each specific SNP allele where white is no call, yellow is AB, blue is BB and red is AA. The region indicated by the dotted line shows absent or incorrect calls in samples after MDA, corresponding to the region where signal loss was detected in dChip-Signal. Columns 1–5 correspond to denatured DNA samples.
Figure 2
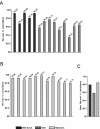
SNP allele concordance. (A) SNP allele concordance between pairs of φ29MDA amplified and unamplified samples (black and dark gray). (B) SNP allele concordance between pairs of unamplified replicates (light gray). (C) Mean concordance in the same pair-wise comparisons as shown in (A) and (B).
Figure 3
Rare homozygous sequence variations in φ29MDA samples. DNA sequence traces for unamplified (upper) and φ29MDA (lower) samples showing a homozygous 2 bp (CT) insertion and a homozygous C→T substitution (white arrows) detected by NQS analysis. All samples were non-denatured.
Figure 4
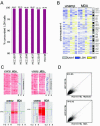
Detection of LOH, homozygous deletions and gene amplification after φ29MDA. (A) Concordance of LOH detection in cancer/normal samples before and after φ29MDA. HCC1007 and HCC1143 tumor/normal pairs and HCC1599 BL were denatured prior to amplification. (B) LOH map of chromosome 4 representative of whole genome LOH maps from six breast cancer/normal pairs. Informative SNP loci showing retention of heterozygosity are shown in yellow, uninformative SNPs (i.e. homozygous or no-call in normal) in gray and SNP alleles undergoing LOH in blue. The first two columns correspond to denatured tumor/normal DNA samples. For the third column, only the normal DNA was denatured. The remaining three columns correspond to all non-denatured tumor/normal pairs. (C) Detection of homozygous deletions and gene amplification. SNP signal intensity is displayed as rows where intensity is normalized on a scale of 0 (white) to 6 (dark red). The upper panels show two representative regions of homozygous deletion on chromosomes 3 and 9 in six breast cancer/normal pairs. The first two columns correspond to tumor samples denatured prior amplification. The lower panel shows representative regions of amplification on chromosomes 12 and 19. Only the individual cancer cell line samples showing gain are shown. Copy number loss or gain is indicated by the blue line in the gray box. HCC1143 was denatured prior amplification whereas HCC1599 was not. (D) Representative SNP hybridization intensity concordance plots. Hybridization intensities from unamplified DNA are plotted against corresponding intensities from a second replicate hybridization of unamplified DNA (top) and from whole genome amplified DNA (bottom). The best fit linear correlation is represented in blue. Correlation coefficients (top left corners), representing signal intensity concordance rates, are similar in both cases. These data are representative examples of all pair-wise MDA/unamplified and unamplified/replicate comparisons examined in this manner. The mean R values for these comparisons are presented in the text.
Figure 5
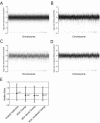
Variation in genome amplification after φ29MDA. All the arrays were normalized using the common baseline array HCC1937 BL_250303 by the invariant set method. Then the model-based signal intensities for all SNPs were calculated by the PM/MM difference model. The log2 signal ratios of all SNPs were calculated and plotted separately for each of the: (A) 11 unamplified replicate pairs; (B) 14 φ29MDA/unamplified pairs; (C) five denatured φ29MDA/unamplified pairs; (D) nine non-denatured φ29MDA/unamplified pairs. The three plots were adjusted to have the same scale for better comparison, thus a few extreme outliers are not shown in some plots. (E) The median ratio for each of the sets of comparisons as well as the range of values encompassing the 25–75th percentile values are shown.
Similar articles
- Investigating the utility of combining phi29 whole genome amplification and highly multiplexed single nucleotide polymorphism BeadArray genotyping.
Pask R, Rance HE, Barratt BJ, Nutland S, Smyth DJ, Sebastian M, Twells RC, Smith A, Lam AC, Smink LJ, Walker NM, Todd JA. Pask R, et al. BMC Biotechnol. 2004 Jul 27;4:15. doi: 10.1186/1472-6750-4-15. BMC Biotechnol. 2004. PMID: 15279678 Free PMC article. - Balanced-PCR amplification allows unbiased identification of genomic copy changes in minute cell and tissue samples.
Wang G, Brennan C, Rook M, Wolfe JL, Leo C, Chin L, Pan H, Liu WH, Price B, Makrigiorgos GM. Wang G, et al. Nucleic Acids Res. 2004 May 21;32(9):e76. doi: 10.1093/nar/gnh070. Nucleic Acids Res. 2004. PMID: 15155823 Free PMC article. - High-resolution genomic copy number profiling of glioblastoma multiforme by single nucleotide polymorphism DNA microarray.
Yin D, Ogawa S, Kawamata N, Tunici P, Finocchiaro G, Eoli M, Ruckert C, Huynh T, Liu G, Kato M, Sanada M, Jauch A, Dugas M, Black KL, Koeffler HP. Yin D, et al. Mol Cancer Res. 2009 May;7(5):665-77. doi: 10.1158/1541-7786.MCR-08-0270. Epub 2009 May 12. Mol Cancer Res. 2009. PMID: 19435819 - Single nucleotide polymorphism array analysis of cancer.
Dutt A, Beroukhim R. Dutt A, et al. Curr Opin Oncol. 2007 Jan;19(1):43-9. doi: 10.1097/CCO.0b013e328011a8c1. Curr Opin Oncol. 2007. PMID: 17133111 Review. - Multiple displacement amplification to create a long-lasting source of DNA for genetic studies.
Lovmar L, Syvänen AC. Lovmar L, et al. Hum Mutat. 2006 Jul;27(7):603-14. doi: 10.1002/humu.20341. Hum Mutat. 2006. PMID: 16786504 Review.
Cited by
- Darwinian Evolution of Self-Replicating DNA in a Synthetic Protocell.
Abil Z, Restrepo Sierra AM, Stan AR, Châne A, Del Prado A, de Vega M, Rondelez Y, Danelon C. Abil Z, et al. Nat Commun. 2024 Oct 22;15(1):9091. doi: 10.1038/s41467-024-53226-0. Nat Commun. 2024. PMID: 39433731 Free PMC article. - High-throughput nanopore DNA sequencing of large insert fosmid clones directly from bacterial colonies.
Chuzel L, Sinha A, Cunningham CV, Taron CH. Chuzel L, et al. Appl Environ Microbiol. 2024 Jun 18;90(6):e0024324. doi: 10.1128/aem.00243-24. Epub 2024 May 20. Appl Environ Microbiol. 2024. PMID: 38767355 Free PMC article. - Identification and classification of the genomes of novel microviruses in poultry slaughterhouse.
Xie K, Lin B, Sun X, Zhu P, Liu C, Liu G, Cao X, Pan J, Qiu S, Yuan X, Liang M, Jiang J, Yuan L. Xie K, et al. Front Microbiol. 2024 May 2;15:1393153. doi: 10.3389/fmicb.2024.1393153. eCollection 2024. Front Microbiol. 2024. PMID: 38756731 Free PMC article. - A primer-independent DNA polymerase-based method for competent whole-genome amplification of intermediate to high GC sequences.
Ordóñez CD, Mayoral-Campos C, Egas C, Redrejo-Rodríguez M. Ordóñez CD, et al. NAR Genom Bioinform. 2023 Aug 21;5(3):lqad073. doi: 10.1093/nargab/lqad073. eCollection 2023 Sep. NAR Genom Bioinform. 2023. PMID: 37608803 Free PMC article. - Back to Basics: A Simplified Improvement to Multiple Displacement Amplification for Microbial Single-Cell Genomics.
Sobol MS, Kaster AK. Sobol MS, et al. Int J Mol Sci. 2023 Feb 21;24(5):4270. doi: 10.3390/ijms24054270. Int J Mol Sci. 2023. PMID: 36901710 Free PMC article.
References
- Nelson J.R., Cai,Y.C., Giesler,T.L., Farchaus,J.W., Sundaram,S.T., Ortiz-Rivera,M., Hosta,L.P., Hewitt,P.L., Mamone,J.A., Palaniappan,C. et al. (2002) TempliPhi, phi29 DNA polymerase based rolling circle amplification of templates for DNA sequencing. Biotechniques, (suppl.), 44–47. - PubMed
- Blanco L., Bernad,A., Lazaro,J.M., Martin,G., Garmendia,C. and Salas,M. (1989) Highly efficient DNA synthesis by the phage phi 29 DNA polymerase. Symmetrical mode of DNA replication. J. Biol. Chem., 264, 8935–8940. - PubMed
Publication types
MeSH terms
Substances
LinkOut - more resources
Full Text Sources
Other Literature Sources
Miscellaneous


