Characterization of release-independent short-term depression in the juvenile rat hippocampus - PubMed (original) (raw)
Characterization of release-independent short-term depression in the juvenile rat hippocampus
J Muñoz-Cuevas et al. J Physiol. 2004.
Abstract
Short-term depression strongly influences neuronal activity in cerebral circuits and contributes to low-pass temporal filtering of information. In this work, we show that synaptic depression evoked by stimulation of commissural-Schaffer collateral afferents at 10 Hz is associated with a reduction of the fibre volley. This depression of action potentials is also evident in the absence of extracellular Ca(2+), which underlies its release-independent nature. In addition, this reduction of the excitability is independent of failures in action potential propagation since increasing the distance between the stimulus and recording electrodes does not alter this effect. Whole-cell recordings show that tetanic stimulation at supraminimal intensity induces action potential failures preceded by changes in the repolarization rate of the action potentials leading the membrane potential to hyperpolarized values. This activity-dependent hyperpolarization was blocked by ouabain, an indication of the important role of the Na(+)-K(+)-ATPase in this process. Then again, an alteration of the firing threshold was observed when action potentials were elicited either by somatic current injection or by synaptic stimulation, which indicates that this mechanism could alter the EPSP-spike coupling in these cells. The results suggest that these factors act together to reduce gradually the safety factor for action potential generation and to produce failures in action potential initiation; in fact, experiments made at twice the supraminimal intensity show a dramatic decrease in the rate of these failures. Taken together, the results suggest the existence of a release-independent component of short-term depression that is related to failures in action potential initiation.
Figures
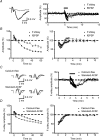
Figure 1. Fibre volley is depressed by repetitive stimulation
A, averaged traces (left) of three consecutive recordings before (black line) and at the end (grey line) of the 10 Hz tetanization. Note the increase of latency and the decrease of amplitude in both the fibre volley and the excitatory postsynaptic potential (fEPSP) at the end of the tetanus. Sample experiment (right) showing the time course of normalized amplitudes of the fEPSP and the fibre volley. B, summary plot of normalized fibre volley amplitudes in representative pulses during (left) and after (right) the tetanic stimulation (n = 7). C, averaged traces (left panel) of three consecutive recordings before (black line) and at the end (grey line) of the 10 Hz tetanization. The left-hand traces show the increase of latency and the decrease of the fibre volley amplitude in both calcium-free and standard ACSF (plus 1–2 μ
m
CNQX) experiments. Depression of the negative peak of fibre volley is greater than that of the positive peak. The right-hand traces show amplitude normalizations of the left traces. In these traces, differences in rise time and half-width appear in both calcium-free and standard ACSF experiments. The sample experiments in the right panel show the time course of normalized amplitudes of the fibre volley in both calcium-free and standard ACSF experiments. D, summary plot of representative pulses during (left) and after (right) tetanic stimulation in calcium-free (n = 46) and standard ACSF (n = 22) experiments. The absence of calcium does not block the short-term depression of the fibre volley. The bars above the plots in A _(_right) and C (right) represents the moment at which the 10 Hz (600 pulses) tetanization was delivered.
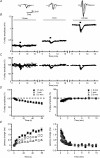
Figure 2. Short-term depression of the fibre volley is independent of axonal propagation failures
A, averaged traces of three consecutive recordings before (black line) and at the end (grey line) of the 10 Hz tetanization at 1.5 mm (left), 1 mm (centre) and 0.5 mm (right) from the stimulus electrode. At high fibre volley amplitudes the baseline of the recordings shifts to positive values during the tetanus (dashed trace in 0.5 mm), indicating a higher ratio of cations to anions in the extracellular space. To allow a better comparison of the waveform of fibre volleys, we have normalized these traces to the baseline (grey line). B, sample experiment showing the time course of fibre volley amplitudes at different distances between stimulus and recording electrodes. The bar above the plot represents the moment at which the 10 Hz (600 pulses) tetanization was delivered. For clarity, the times are reset for each condition since real times are usually longer. Note how fibre volley amplitude increases as distance between electrodes decreases. C, the same experiment as B but with fibre volley amplitudes normalized to allow a better comparison between conditions. D, summary plot of normalized fibre volley amplitudes in representative pulses during (left) and after (right) the tetanus at different distances between stimulus and recording electrodes (n = 7). No differences are detected when distances between electrodes vary. E, summary plot of latency changes in representative pulses during (left) and after (right) the tetanus at different distances between stimulus and recording electrodes (n = 7). Latency changes induced by 10 Hz stimulation increase with the distance between electrodes, indicating changes in conduction velocity.
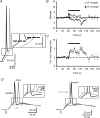
Figure 4. Changes in firing threshold during somatic current injection and synaptically induced EPSPs at 10 Hz stimulation
A, sample traces of APs induced by somatic current injection recorded at pre-tetanus (black trace) and at the 372nd pulse (grey trace) of the tetanus, recordings at which the resting membrane potential was the same. Note how the firing threshold (dashed line) shifts to depolarized values during the tetanus. B, summary plot showing the time course of firing threshold (_V_t) and membrane potential (_V_m) changes (n = 10). Note how changes in _V_t are developed and extinguished rapidly while those of _V_m are maximal after the end of the tetanus. C, summary plot showing the time course of the changes in voltage jump (_V_t–_V_m) necessary to reach the firing threshold (n = 10). At the onset of the tetanus there is no net change in this value, but after a few pulses (coinciding with _V_m hyperpolarization; see B), it increases rapidly and reaches its maximal value once the tetanus has ceased. D, sample traces of APs induced by synaptic EPSPs evoked by stimulation of commissural fibres. Thick black traces (control) show EPSPs recorded in current clamp at a _V_m of ∼−10 mV from the resting membrane potential before the tetanic stimulation (see Methods). Thin black trace (23rd pulse) and grey trace (25th pulse) in the left panel show EPSPs recorded at resting membrane potential during the tetanic stimulation. Grey trace in the right panel represents the 19th EPSP of the 10 Hz tetanus recorded at resting membrane potential. Both panels show how the firing threshold (dashed line) shifts to depolarized values during the tetanus, inducing failures in AP generation at the same _V_m and EPSP slope at which the cell previously fired (left panel). Interestingly, shifts in firing threshold can be observed even in faster slopes of the EPSP and shorter latencies from the stimulus onset (right panel). To allow a better comparison, all the recordings are amplified at the moment of the AP onset (see boxes in A and D). The bars in the summary plots represent the moment at which the 10 Hz (600 pulses) tetanization was delivered.
Figure 8. Activity-dependent hyperpolarization is blocked by ouabain
A, sample traces of APs evoked by 1-ms 2 × SM somatic current pulses before (black traces) and at the end (grey traces) of the tetanus. B, summary graph of the time courses of _V_m changes during tetanization in both standard ACSF (n = 6) and standard ACSF plus 5 μ
m
ouabain (n = 4). Note how experiments performed under ouabain-containing Ringer solution developed an activity-dependent depolarization instead of an activity-dependent hyperpolarization. The bar above the plot represents the moment at which the 10 Hz (600 pulses) tetanization was delivered.
Figure 3. Changes in AP latency, failures and waveform during 10 Hz stimulation
A, sample traces of APs recorded at pre-tetanus (black trace) and the beginning of the tetanus (grey lines). For clarity, only one of every two APs is shown. Note how the AP latency increases before a failure occurs. B, summary graphs of the time courses of _V_m (▪, n = 20) and latency (□, n = 16) changes. Note the similar time courses, although of opposite sign, of the parameters. C, graph showing the values of the correlation between the changes in _V_m and latency during the tetanus. Each circle represents the value of one experiment. •, significant correlations (P < 0.05); ○, non-significant correlations. D, summary graph of the averaged failures during the tetanus (n = 20). Zero value indicates the onset of the tetanus, so at this time no failures are produced. The rest of the values indicate the percentage of AP failures every 60 pulses (i.e AP failures between pulses 1–60, 61–120, 121–180 and so on). E, left: sample traces of APs recorded at pre-tetanus (black trace) and at the 486th pulse (grey trace) of the tetanus. These recordings were chosen because membrane potential is the same for both APs. For clarity, the recordings are normalized to the AP onset. E, right: summary plot indicating the time course of depolarization rate (n = 16). Note how changes in this parameter are developed and extinguished rapidly. F, graph showing the values of the correlation between the changes in depolarization rate and latency during the tetanus. Each circle represents the value of one experiment. •, significant correlations (P < 0.05); ○, non-significant correlations. Note the high variability of correlation values. G, left: the same sample traces as in E but, on this occasion, the test AP (grey trace) is normalized to the amplitude of the pre-tetanic AP (black trace). G, right: summary plot indicating the time course of fast repolarization rate (n = 16). H, left: the same traces as in E but with the test AP (grey trace) normalized to the amplitude of the pre-tetanic AP (black trace) and the time scale increased to allow a better comparison of the slow repolarizing component. G, right: summary plot indicating the time course of slow repolarization rate (n = 16) showing how this parameter increases gradually during the tetanus and decreases slowly at the end of the 10 Hz stimulation. The bars in all summary plots represent the moment at which the 10 Hz (600 pulses) tetanization was delivered.
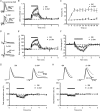
Figure 5. Changes in AP waveform and block of AP failures induced by 10 Hz stimulation at 2 × SM intensity
A, sample whole-cell recordings of experiments at SM and 2 × SM intensities. The vertical dashed lines show pre-tetanic AP onset, and the horizontal ones the resting membrane potential. B, summary plot of time course of the latency changes at both SM (n = 10) and 2 × SM (n = 6) intensities. C, summary graph of the averaged failures during the tetanus at both SM (n = 10) and 2 × SM (n = 6) intensities. Zero value indicates the onset of the tetanus so at this time no failures occur. The remaining values indicate the percentage of AP failures every 60 pulses (i.e. AP failures between pulses 1–60, 61–120, 121–180 and so on). Note the small proportion of failures at 2 × SM intensity. D, sample traces of whole-cell recordings plotted at wide time scale to allow a better observation of the slow repolarization rate. E, summary plot indicating the time course of slow repolarization rate at SM (n = 13) and 2 × SM (n = 6) intensities. F, summary graph of the time courses of _V_m changes at SM (n = 13) and 2 × SM (n = 6) intensities. Note how membrane potential becomes more hyperpolarized in the high intensity protocol. G, top: the same sample traces as in D but the test APs is normalized to the amplitude of the pre-tetanic APs and the time scale is reduced. G, bottom: summary plot indicating the time course of fast repolarization rate at SM (n = 9) and 2 × SM (n = 6) intensities. H, top: the same sample traces as in D but for clarity the recordings are normalized to the AP onset and the time-scale has been reduced. H, bottom: summary plot indicating the time course of depolarization rate at SM (n = 9) and 2 × SM (n = 6) intensities. All recordings represented by black lines show pre-tetanic APs, and those by grey lines show the last AP of the tetanus. The bars in all summary plots represent the moment at which the 10 Hz (600 pulses) tetanization was delivered.
Figure 6. Patterns of AP failures during 10 Hz stimulation
A, representative experiment showing the time course of AP amplitude and membrane potential changes at SM intensity. Note how successful APs are grouped in sets resembling bursts. Changes in _V_m are also evident during ‘burst’ and ‘interburst’ periods. B, representative experiment showing the time course of AP amplitude and membrane potential changes at 2 × SM intensity. AP amplitudes hardly vary and no AP failures are observed. In these experiments, hyperpolarizations are stronger than those observed in SM experiments, indicating an accumulative effect of APs on this mechanism. C, summary graph of _V_m values at different moments of the tetanus at SM intensity (n = 8). White bars represent control (last pulse prior to tetanic stimulation) _V_m values. Note that these values are the same as those we called 1st AP of the 1st set. The first set refers to the first group of successful action potentials and the last set to the last complete group of successful APs. D, summary graph of AP amplitude values at different moments of the tetanus at SM (n = 8) and 2 × SM (n = 7) intensities. White bars represent baseline values. Baseline values and sets of AP are defined as in C. The bars above the plots in A and B represent the moment at which the 10 Hz (600 pulses) tetanization was delivered. *P < 0.05, and **P < 0.01, significant differences (Student's paired t test); # non-significant differences.
Figure 7. Patterns of changes in AP waveform during 10 Hz stimulation
A, top: sample traces of the first (black lines) and the last (grey lines) AP of the first and the last set of APs normalized to the AP onset. A, bottom: summary graph of the depolarization rate at different moments of the tetanus (n = 7) in experiments with AP failures. B, top: traces of the same cell as in A but without normalization to the AP onset and at different time scales. B, bottom: summary graph of the latency values at different moments of the tetanus (n = 7) in experiments with AP failures. C, top: the same traces as in B but AP amplitudes have been truncated. C, bottom: summary graph of the slow repolarization rate values at different moments of the tetanus (n = 7) in experiments with AP failures. D, top: sample traces normalized to the amplitude of the first AP of the corresponding set of APs to allow a better comparison of the repolarizing rate. D, bottom: summary graph of the fast repolarization rate values at different moments of the tetanus (n = 7) in experiments with AP failures. White bars in summary graphs represent control (last pulse before tetanic stimulation) values. Note that these values coincide with those we also called 1st AP of the 1st set. The first set refers to the first group of successful action potentials and the last set to the last group of successful APs that precedes an AP failure. All recordings plotted with black lines show the first AP of each set of successful APs. For clarity, each AP is labelled with its ordinal number in the tetanus. 39th and 580th pulses represent the last AP of each set of successful APs. * P < 0.05, ** P < 0.01, *** P < 0.001, significant differences (Student's paired t test); # non-significant differences.
Similar articles
- Augmentation of excitability in the hippocampus of juvenile rat.
Muñoz-Cuevas J, Vara H, Colino A. Muñoz-Cuevas J, et al. Neuroscience. 2006 Nov 17;143(1):39-50. doi: 10.1016/j.neuroscience.2006.07.020. Epub 2006 Sep 14. Neuroscience. 2006. PMID: 16978791 - Mechanisms of neuronal hyperexcitability caused by partial inhibition of Na+-K+-ATPases in the rat CA1 hippocampal region.
Vaillend C, Mason SE, Cuttle MF, Alger BE. Vaillend C, et al. J Neurophysiol. 2002 Dec;88(6):2963-78. doi: 10.1152/jn.00244.2002. J Neurophysiol. 2002. PMID: 12466422 - Differences in multiple forms of short-term plasticity between excitatory and inhibitory hippocampal neurons in culture.
Kaplan MP, Wilcox KS, Dichter MA. Kaplan MP, et al. Synapse. 2003 Oct;50(1):41-52. doi: 10.1002/syn.10244. Synapse. 2003. PMID: 12872293 - Spike-dependent intrinsic plasticity increases firing probability in rat striatal neurons in vivo.
Mahon S, Casassus G, Mulle C, Charpier S. Mahon S, et al. J Physiol. 2003 Aug 1;550(Pt 3):947-59. doi: 10.1113/jphysiol.2003.043125. Epub 2003 Jul 4. J Physiol. 2003. PMID: 12844508 Free PMC article. - Matrix metalloprotease activity shapes the magnitude of EPSPs and spike plasticity within the hippocampal CA3 network.
Wójtowicz T, Mozrzymas JW. Wójtowicz T, et al. Hippocampus. 2014 Feb;24(2):135-53. doi: 10.1002/hipo.22205. Epub 2013 Oct 15. Hippocampus. 2014. PMID: 24115249
Cited by
- A delayed response enhancement during hippocampal presynaptic plasticity in mice.
Jensen V, Walaas SI, Hilfiker S, Ruiz A, Hvalby Ø. Jensen V, et al. J Physiol. 2007 Aug 15;583(Pt 1):129-43. doi: 10.1113/jphysiol.2007.131300. Epub 2007 Jun 14. J Physiol. 2007. PMID: 17569738 Free PMC article. - Suppression of spikes during posttetanic hyperpolarization in auditory neurons: the role of temperature, I(h) currents, and the Na(+)-K(+)-ATPase pump.
Kim JH, von Gersdorff H. Kim JH, et al. J Neurophysiol. 2012 Oct;108(7):1924-32. doi: 10.1152/jn.00103.2012. Epub 2012 Jul 11. J Neurophysiol. 2012. PMID: 22786951 Free PMC article. - Interaction of short-term depression and firing dynamics in shaping single neuron encoding.
Mohan A, McDonnell MD, Stricker C. Mohan A, et al. Front Comput Neurosci. 2013 Apr 19;7:41. doi: 10.3389/fncom.2013.00041. eCollection 2013. Front Comput Neurosci. 2013. PMID: 23626533 Free PMC article. - Short-term presynaptic plasticity.
Regehr WG. Regehr WG. Cold Spring Harb Perspect Biol. 2012 Jul 1;4(7):a005702. doi: 10.1101/cshperspect.a005702. Cold Spring Harb Perspect Biol. 2012. PMID: 22751149 Free PMC article. Review. - A novel short-term plasticity of intrinsic excitability in the hippocampal CA1 pyramidal cells.
Sánchez-Aguilera A, Sánchez-Alonso JL, Vicente-Torres MA, Colino A. Sánchez-Aguilera A, et al. J Physiol. 2014 Jul 1;592(13):2845-64. doi: 10.1113/jphysiol.2014.273185. Epub 2014 Apr 22. J Physiol. 2014. PMID: 24756640 Free PMC article.
References
- Abbott LF, Varela JA, Sen K, Nelson SB. Synaptic depression and cortical gain control. Science. 1997;275:220–224. - PubMed
- Beaumont V, Zhong N, Froemke RC, Ball RW, Zucker RS. Temporal synaptic tagging by I(h) activation and actin: involvement in long-term facilitation and cAMP-induced synaptic enhancement. Neuron. 2002;33:601–613. - PubMed
Publication types
MeSH terms
Substances
LinkOut - more resources
Full Text Sources
Miscellaneous


