Twinkle and POLG defects enhance age-dependent accumulation of mutations in the control region of mtDNA - PubMed (original) (raw)
Twinkle and POLG defects enhance age-dependent accumulation of mutations in the control region of mtDNA
Sjoerd Wanrooij et al. Nucleic Acids Res. 2004.
Abstract
Autosomal dominant and/or recessive progressive external ophthalmoplegia (ad/arPEO) is associated with mtDNA mutagenesis. It can be caused by mutations in three nuclear genes, encoding the adenine nucleotide translocator 1, the mitochondrial helicase Twinkle or DNA polymerase gamma (POLG). How mutations in these genes result in progressive accumulation of multiple mtDNA deletions in post- mitotic tissues is still unclear. A recent hypothesis suggested that mtDNA replication infidelity could promote slipped mispairing, thereby stimulating deletion formation. This hypothesis predicts that mtDNA of ad/arPEO patients will contain frequent mutations throughout; in fact, our analysis of muscle from ad/arPEO patients revealed an age-dependent, enhanced accumulation of point mutations in addition to deletions, but specifically in the mtDNA control region. Both deleted and non-deleted mtDNA molecules showed increased point mutation levels, as did mtDNAs of patients with a single mtDNA deletion, suggesting that point mutations do not cause multiple deletions. Deletion breakpoint analysis showed frequent breakpoints around homopolymeric runs, which could be a signature of replication stalling. Therefore, we propose replication stalling as the principal cause of deletion formation.
Figures
Figure 1
Pedigrees of PEO families. (A) POLG N468D/A1105T pedigree including patients 3–5 and controls 1–5 (see also Table 1). Black symbols indicate affected family members, white symbols unaffected ones, and the gray symbol indicates unknown disease status of a subject. A slash over a symbol denotes deceased individuals. (B) Twinkle dupAA352–364 pedigree including patients 7–11 and controls 7–10. Numbers below patient numbers indicate age at the time of biopsy.
Figure 2
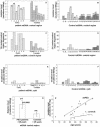
Point mutation levels in the control and cyt b region of PEO patient muscle mtDNA. (A and B) Number of different mutations detected per 10 kb of control region mtDNA in PEO patients (A) and in different types of controls (B). Numbers above the bars indicate the age at the time of biopsy. (C and D) Number of cloned mtDNA control region fragments carrying at least one point mutation in PEO patients (C) and in controls (D), expressed as a percentage of the total number of clones that were sequenced. (E and F) Number of different mutations detected per 10 kb of cyt b gene sequence in PEO patients (E) and in controls (F). Patients and abbreviations: 1–6, POLG/PEO patients, skeletal muscle; 7EM, Twinkle/PEO patient, extraocular muscle; 8FC, Twinkle/PEO patient, frontal cortex; 1L, 2L, POLG/PEO patients 1 and 2, leukocytes; Δ1–Δ5, patients with sporadic single mtDNA deletions, skeletal muscle; C1–C10, healthy control samples, skeletal muscle. (G) Number of different control region mutations in muscle mtDNAs of PEO patients >35 years old grouped together, and in the >35-year-old controls. The probability (P) of both groups being identical was calculated using the unpaired Student’s _t_-test. The indicated results show that mutation level differences between both groups are highly significant. (H) Mitochondrial control region mutation levels in PEO patients (filled diamonds), healthy controls (open circles) and single deletion controls (+), related to the age at the time of biopsy, based on the values also indicated in (A) and (B). Lines for the PEO patients and healthy controls indicate trend lines.
Figure 3
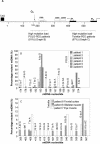
Non-random distribution and heteroplasmy levels of control region mutations. (A) Diagram of the mtDNA control region and mutational hotspots. Abbreviations and symbols: OH, heavy strand replication origin; PH and PL, H and L strand promoters; TAS, termination-associated sequence; CSB I, II and III, conserved sequence blocks I, II and III; bold dotted lines, the regions where most mutations were found in POLG/PEO and Twinkle/PEO patients’ muscle mtDNA; percentages in parentheses, the percentage of mutated fragments with mutations in the indicated region; small dotted line adjacent to OH, A to G conversion mutational hotspot region of patient 2; dashed line, position of the duplication hotspot in patient 1. (B) Pattern of mutations in the mtDNA replication control region of POLG/PEO patients between nucleotides 174 and 214. (C) Mutation pattern in the mtDNA transcription control region of Twinkle patients 7 and 8. The percentage of mutant mtDNA in (B) and (C) indicates the number of clones with the indicated mutation in the indicated patients relative to the total number of clones sequenced for each patient.
Figure 4
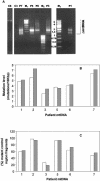
Detection of multiple mtDNA deletions in PEO patients by long-range Pfu PCR and comparison of control region mutation levels between the deleted and the total mtDNA population. (A) DNA fragments amplified from muscle mtDNA of patients 1, 3, 5, 6 and 7 and control muscle mtDNA were separated on a 1% agarose gel and stained with ethidium bromide. Abbreviations: M1, M2 and M3, DNA size markers indicated in kb; C3 and C8, controls 3 and 8. Deletion PCR was performed as described in Materials and Methods using primers FR31 and 611H/l (Table 2b), amplifying the mtDNA region between nt 7177 and 611. Note that the PCR from C8 did show a faint band corresponding to the full-length mtDNA fragment. (B) The number of point mutations in the control region detected in deleted mtDNA molecules (gray bars) and in the total population of mtDNA molecules as determined in Figure 1 (white bars) of patients 1–3 and 5–7. (C) The number of mtDNA fragments carrying a mutation in skeletal muscle mtDNA of patients 1–3 and 5–7.
Similar articles
- Association of novel POLG mutations and multiple mitochondrial DNA deletions with variable clinical phenotypes in a Spanish population.
González-Vioque E, Blázquez A, Fernández-Moreira D, Bornstein B, Bautista J, Arpa J, Navarro C, Campos Y, Fernández-Moreno MA, Garesse R, Arenas J, Martín MA. González-Vioque E, et al. Arch Neurol. 2006 Jan;63(1):107-11. doi: 10.1001/archneur.63.1.107. Arch Neurol. 2006. PMID: 16401742 - Novel Twinkle (PEO1) gene mutations in mendelian progressive external ophthalmoplegia.
Virgilio R, Ronchi D, Hadjigeorgiou GM, Bordoni A, Saladino F, Moggio M, Adobbati L, Kafetsouli D, Tsironi E, Previtali S, Papadimitriou A, Bresolin N, Comi GP. Virgilio R, et al. J Neurol. 2008 Sep;255(9):1384-91. doi: 10.1007/s00415-008-0926-3. Epub 2008 Jun 30. J Neurol. 2008. PMID: 18575922 - Digenic progressive external ophthalmoplegia in a sporadic patient: recessive mutations in POLG and C10orf2/Twinkle.
Van Goethem G, Löfgren A, Dermaut B, Ceuterick C, Martin JJ, Van Broeckhoven C. Van Goethem G, et al. Hum Mutat. 2003 Aug;22(2):175-6. doi: 10.1002/humu.10246. Hum Mutat. 2003. PMID: 12872260 No abstract available. - Progressive external ophthalmoplegia and multiple mitochondrial DNA deletions.
Van Goethem G, Martin JJ, Van Broeckhoven C. Van Goethem G, et al. Acta Neurol Belg. 2002 Mar;102(1):39-42. Acta Neurol Belg. 2002. PMID: 12094562 Review. - [ANT1, twinkle, POLG mutation].
Komaki H, Goto Y. Komaki H, et al. Nihon Rinsho. 2002 Apr;60 Suppl 4:353-6. Nihon Rinsho. 2002. PMID: 12013885 Review. Japanese. No abstract available.
Cited by
- The DNA polymerase gamma Y955C disease variant associated with PEO and parkinsonism mediates the incorporation and translesion synthesis opposite 7,8-dihydro-8-oxo-2'-deoxyguanosine.
Graziewicz MA, Bienstock RJ, Copeland WC. Graziewicz MA, et al. Hum Mol Genet. 2007 Nov 15;16(22):2729-39. doi: 10.1093/hmg/ddm227. Epub 2007 Aug 27. Hum Mol Genet. 2007. PMID: 17725985 Free PMC article. - Therapy Prospects for Mitochondrial DNA Maintenance Disorders.
Ramón J, Vila-Julià F, Molina-Granada D, Molina-Berenguer M, Melià MJ, García-Arumí E, Torres-Torronteras J, Cámara Y, Martí R. Ramón J, et al. Int J Mol Sci. 2021 Jun 16;22(12):6447. doi: 10.3390/ijms22126447. Int J Mol Sci. 2021. PMID: 34208592 Free PMC article. Review. - Mutant mitochondrial helicase Twinkle causes multiple mtDNA deletions and a late-onset mitochondrial disease in mice.
Tyynismaa H, Mjosund KP, Wanrooij S, Lappalainen I, Ylikallio E, Jalanko A, Spelbrink JN, Paetau A, Suomalainen A. Tyynismaa H, et al. Proc Natl Acad Sci U S A. 2005 Dec 6;102(49):17687-92. doi: 10.1073/pnas.0505551102. Epub 2005 Nov 21. Proc Natl Acad Sci U S A. 2005. PMID: 16301523 Free PMC article. - DNA sequences proximal to human mitochondrial DNA deletion breakpoints prevalent in human disease form G-quadruplexes, a class of DNA structures inefficiently unwound by the mitochondrial replicative Twinkle helicase.
Bharti SK, Sommers JA, Zhou J, Kaplan DL, Spelbrink JN, Mergny JL, Brosh RM Jr. Bharti SK, et al. J Biol Chem. 2014 Oct 24;289(43):29975-93. doi: 10.1074/jbc.M114.567073. Epub 2014 Sep 5. J Biol Chem. 2014. PMID: 25193669 Free PMC article. - Enhanced mitochondrial G-quadruplex formation impedes replication fork progression leading to mtDNA loss in human cells.
Doimo M, Chaudhari N, Abrahamsson S, L'Hôte V, Nguyen TVH, Berner A, Ndi M, Abrahamsson A, Das RN, Aasumets K, Goffart S, Pohjoismäki JLO, López MD, Chorell E, Wanrooij S. Doimo M, et al. Nucleic Acids Res. 2023 Aug 11;51(14):7392-7408. doi: 10.1093/nar/gkad535. Nucleic Acids Res. 2023. PMID: 37351621 Free PMC article.
References
- Satoh M. and Kuroiwa,T. (1991) Organization of multiple nucleoids and DNA molecules in mitochondria of a human cell. Exp. Cell Res., 196, 137–140. - PubMed
- Grossman L.I. and Shoubridge,E.A. (1996) Mitochondrial genetics and human disease. Bioessays, 18, 983–991. - PubMed
- Mandel H., Szargel,R., Labay,V., Elpeleg,O., Saada,A., Shalata,A., Anbinder,Y., Berkowitz,D., Hartman,C., Barak,M. et al. (2001) The deoxyguanosine kinase gene is mutated in individuals with depleted hepatocerebral mitochondrial DNA. Nature Genet., 29, 337–341. - PubMed
- Saada A., Shaag,A., Mandel,H., Nevo,Y., Eriksson,S. and Elpeleg,O. (2001) Mutant mitochondrial thymidine kinase in mitochondrial DNA depletion myopathy. Nature Genet., 29, 342–344. - PubMed
Publication types
MeSH terms
Substances
LinkOut - more resources
Full Text Sources
Medical
Molecular Biology Databases


