Structural basis of long-term potentiation in single dendritic spines - PubMed (original) (raw)
Structural basis of long-term potentiation in single dendritic spines
Masanori Matsuzaki et al. Nature. 2004.
Abstract
Dendritic spines of pyramidal neurons in the cerebral cortex undergo activity-dependent structural remodelling that has been proposed to be a cellular basis of learning and memory. How structural remodelling supports synaptic plasticity, such as long-term potentiation, and whether such plasticity is input-specific at the level of the individual spine has remained unknown. We investigated the structural basis of long-term potentiation using two-photon photolysis of caged glutamate at single spines of hippocampal CA1 pyramidal neurons. Here we show that repetitive quantum-like photorelease (uncaging) of glutamate induces a rapid and selective enlargement of stimulated spines that is transient in large mushroom spines but persistent in small spines. Spine enlargement is associated with an increase in AMPA-receptor-mediated currents at the stimulated synapse and is dependent on NMDA receptors, calmodulin and actin polymerization. Long-lasting spine enlargement also requires Ca2+/calmodulin-dependent protein kinase II. Our results thus indicate that spines individually follow Hebb's postulate for learning. They further suggest that small spines are preferential sites for long-term potentiation induction, whereas large spines might represent physical traces of long-term memory.
Conflict of interest statement
Competing interests statement The authors declare that they have no competing financial interests.
Figures
Figure 1
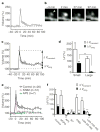
Spine-head enlargement induced by repetitive uncaging of MNI-glutamate. a, Time-lapse images of dendritic spines on a hippocampal CA1 pyramidal neuron expressing eGFP. The arrowhead indicates the spot of two-photon uncaging of MNI-glutamate, which was achieved by stimulation for 1 min at 1 Hz, beginning at time zero in a bathing solution lacking Mg. Images were stacked along the z axis. Scale bar, 1 μm. b, Time course of spine-head volume, estimated from stacked images, of the stimulated (black circles) and neighbouring (green diamonds) spines shown in a. c, Time-lapse images of a spine on a dendrite that was affected by electrical stimulation of presynaptic fibres at 2 Hz for 1 min; d, time course of the head volume. e, Fluorescence intensity along a line crossing the centre of the stimulated spine head shown in a at −3 min (black circles) and 81 min (red circles). Smooth black and red lines represent the predictions made for the z-stacked images of spheres with diameters of 0.46 and 0.59 μm, respectively (see Supplementary Methods). The dashed line is scaled from the smooth black one. f, h, Averaged time courses of spine-head volume for two-photon uncaging of MNI-glutamate (circles, n = 40), neighbouring spines (green diamonds in h, n = 34), 2-Hz electrical stimulation in the absence of Mg (blue open triangles, n = 19) or 100 Hz electrical stimulation in the presence of Mg (blue closed triangles, n = 14). Error bars represent +/− s.e.m. g, Initial time course of spine fluorescence. The intensity in a single plane drawn through the centre of the spines was sampled; the average for 11 spines is shown. Dotted lines show time courses corresponding to the mean +/− s.d., and the horizontal bar indicates the period of repetitive uncaging.
Figure 2
Properties of the spine-head enlargement. a, c, Averaged time course (+/− s.e.m.) of spine-head volume for large (a) and small (c) spines with an initial head volume of > 0.1 μm3 (n = 20) and < 0.1 μm3 (n = 20), respectively. ΔV transient represents the difference in spine-head volume between 1–5 and 70–100 min after stimulation, whereas ΔV long represents that between 70–100 min after and 0–20 min before stimulation. b, Example of an enlargement of a large spine. The arrowhead indicates the point of two-photon uncaging of MNI-glutamate. d, Mean values of ΔV transient and DV long for small and large spines (n = 20 each). e, Effects of 50 μM AP5 or 4 μM KN62 on the averaged time course (+/− s.e.m.) of spine-head volume for small spines. f, Pharmacological properties of the transient and long-lasting phases of head enlargement in small spines. Antagonists examined were 1 mM MCPG (n = 15), 50 μM AP5 (n = 7), 20 μM W7 (n = 11), 4 μM KN62 (n = 12) and 20 nM (n = 12) or 100 nM latrunculin A (n = 7). *P < 0.05, **P < 0.01 (Mann–Whitney U test). Errors bars in d and f show s.e.m.
Figure 3
Colocalization of enlargement of spine heads and potentiation of AMPA- receptor-mediated currents. a, b, Examples of small spines that showed transient (a) or long-lasting (b) enlargement (upper panels) and potentiation of AMPA currents (lower panels). Three-dimensional mapping of AMPA currents was performed in neurons that were clamped in the perforated-patch mode. The amplitude of AMPA currents is pseudocolour coded and stacked along the z axis by the maximum-intensity method. The neurons were depolarized to 0 mV and the small spines, indicated by the arrowheads, were stimulated by two-photon uncaging of MNI-glutamate at 2 Hz between times 0 and 60 s. White lines in the lower panels indicate contours of dendrites. Scale bars, 1 μm. c, d, Examples of small (c) and large (d) spines whose heads failed to enlarge in response to paired stimulation.
Figure 4
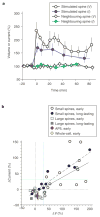
Relationship between spine-head enlargement and potentiation of AMPA- receptor-mediated currents. a, Time courses (+/− s.e.m.) of spine-head volume (V, open symbols) and maximal AMPA currents (I, filled symbols) normalized to the original values. The data were derived from all the small spines (n = 9) that showed enlargement immediately after pairing stimulation and for which it was possible to obtain current maps more than 30 min after paired stimulation in the perforated-patch recording mode. Circles and diamonds represent stimulated and neighbouring spines, respectively. b, Relationships between normalized amplitudes of head enlargement (ΔV) and potentiation of AMPA currents (ΔCurrent) in the early phase (1–5 min after stimulation) and long- lasting phase (30–120 min) in small and large spines. The continuous and dashed lines are regression lines for the early and long-lasting phases, respectively; correlation coefficients are 0.72 (n = 24, P < 0.0001) and 0.95 (n = 9, P < 0.0001), respectively. The red and yellow crosses show data obtained in the presence of AP5 (n = 5) or with whole-cell recording (n = 7), respectively. Black and blue dotted lines are 0% and 30% levels, respectively.
Similar articles
- Dendritic spine geometry is critical for AMPA receptor expression in hippocampal CA1 pyramidal neurons.
Matsuzaki M, Ellis-Davies GC, Nemoto T, Miyashita Y, Iino M, Kasai H. Matsuzaki M, et al. Nat Neurosci. 2001 Nov;4(11):1086-92. doi: 10.1038/nn736. Nat Neurosci. 2001. PMID: 11687814 Free PMC article. - Long-term potentiation-dependent spine enlargement requires synaptic Ca2+-permeable AMPA receptors recruited by CaM-kinase I.
Fortin DA, Davare MA, Srivastava T, Brady JD, Nygaard S, Derkach VA, Soderling TR. Fortin DA, et al. J Neurosci. 2010 Sep 1;30(35):11565-75. doi: 10.1523/JNEUROSCI.1746-10.2010. J Neurosci. 2010. PMID: 20810878 Free PMC article. - Intracellular calcium stores mediate metaplasticity at hippocampal dendritic spines.
Mahajan G, Nadkarni S. Mahajan G, et al. J Physiol. 2019 Jul;597(13):3473-3502. doi: 10.1113/JP277726. Epub 2019 Jun 2. J Physiol. 2019. PMID: 31099020 Free PMC article. - Estradiol and the relationship between dendritic spines, NR2B containing NMDA receptors, and the magnitude of long-term potentiation at hippocampal CA3-CA1 synapses.
Smith CC, Vedder LC, McMahon LL. Smith CC, et al. Psychoneuroendocrinology. 2009 Dec;34 Suppl 1:S130-42. doi: 10.1016/j.psyneuen.2009.06.003. Psychoneuroendocrinology. 2009. PMID: 19596521 Free PMC article. Review. - Regulation of neuronal PKA signaling through AKAP targeting dynamics.
Dell'Acqua ML, Smith KE, Gorski JA, Horne EA, Gibson ES, Gomez LL. Dell'Acqua ML, et al. Eur J Cell Biol. 2006 Jul;85(7):627-33. doi: 10.1016/j.ejcb.2006.01.010. Epub 2006 Feb 28. Eur J Cell Biol. 2006. PMID: 16504338 Review.
Cited by
- Integration of biochemical and electrical signaling-multiscale model of the medium spiny neuron of the striatum.
Mattioni M, Le Novère N. Mattioni M, et al. PLoS One. 2013 Jul 3;8(7):e66811. doi: 10.1371/journal.pone.0066811. Print 2013. PLoS One. 2013. PMID: 23843966 Free PMC article. - From abnormal hippocampal synaptic plasticity in down syndrome mouse models to cognitive disability in down syndrome.
Cramer N, Galdzicki Z. Cramer N, et al. Neural Plast. 2012;2012:101542. doi: 10.1155/2012/101542. Epub 2012 Jul 12. Neural Plast. 2012. PMID: 22848844 Free PMC article. Review. - Dendritic Spines as Tunable Regulators of Synaptic Signals.
Tønnesen J, Nägerl UV. Tønnesen J, et al. Front Psychiatry. 2016 Jun 9;7:101. doi: 10.3389/fpsyt.2016.00101. eCollection 2016. Front Psychiatry. 2016. PMID: 27340393 Free PMC article. - Therapeutic potential of a TrkB agonistic antibody for Alzheimer's disease.
Wang S, Yao H, Xu Y, Hao R, Zhang W, Liu H, Huang Y, Guo W, Lu B. Wang S, et al. Theranostics. 2020 May 23;10(15):6854-6874. doi: 10.7150/thno.44165. eCollection 2020. Theranostics. 2020. PMID: 32550908 Free PMC article. - Slippery signaling: Palmitoylation-dependent control of neuronal kinase localization and activity.
Montersino A, Thomas GM. Montersino A, et al. Mol Membr Biol. 2015 Aug-Dec;32(5-8):179-88. doi: 10.1080/09687688.2016.1182652. Epub 2016 May 31. Mol Membr Biol. 2015. PMID: 27241460 Free PMC article. Review.
References
- Van Harreveld A, Fifkova E. Swelling of dendritic spines in the fascia dentata after stimulation of the perforant fibers as a mechanism of post-tetanic potentiation. Exp Neurol. 1975;49:736–749. - PubMed
- Trachtenberg JT, et al. Long-term in vivo imaging of experience-dependent synaptic plasticity in adult cortex. Nature. 2002;420:788–794. - PubMed
- Grutzendler J, Kasthuri N, Gan WB. Long-term dendritic spine stability in the adult cortex. Nature. 2002;420:812–816. - PubMed
- Maletic-Savatic M, Malinow R, Svoboda K. Rapid dendritic morphogenesis in CA1 hippocampal dendrites induced by synaptic activity. Science. 1999;283:1923–1927. - PubMed
- Engert F, Bonhoeffer T. Dendritic spine changes associated with hippocampal long-term synaptic plasticity. Nature. 1999;399:66–70. - PubMed
Publication types
MeSH terms
Substances
LinkOut - more resources
Full Text Sources
Other Literature Sources
Miscellaneous


