Deregulation of cyclin E in human cells interferes with prereplication complex assembly - PubMed (original) (raw)
Deregulation of cyclin E in human cells interferes with prereplication complex assembly
Susanna Ekholm-Reed et al. J Cell Biol. 2004.
Abstract
Deregulation of cyclin E expression has been associated with a broad spectrum of human malignancies. Analysis of DNA replication in cells constitutively expressing cyclin E at levels similar to those observed in a subset of tumor-derived cell lines indicates that initiation of replication and possibly fork movement are severely impaired. Such cells show a specific defect in loading of initiator proteins Mcm4, Mcm7, and to a lesser degree, Mcm2 onto chromatin during telophase and early G1 when Mcm2-7 are normally recruited to license origins of replication. Because minichromosome maintenance complex proteins are thought to function as a heterohexamer, loading of Mcm2-, Mcm4-, and Mcm7-depleted complexes is likely to underlie the S phase defects observed in cyclin E-deregulated cells, consistent with a role for minichromosome maintenance complex proteins in initiation of replication and fork movement. Cyclin E-mediated impairment of DNA replication provides a potential mechanism for chromosome instability observed as a consequence of cyclin E deregulation.
Figures
Figure 1.
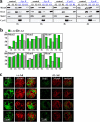
Cell cycle effects on deregulation of cyclin E expression. (a) Time course of S phase entry of cyclin E–deregulated and control cells. Cells transduced with cyclin E recombinant adenovirus (E-Ad) and control adenovirus (c-Ad) were synchronized by mitotic shake-off and replated into medium containing BrdU. S phase entry was scored by immunofluorescence microscopy using anti-BrdU antibodies. The experiment was performed in triplicate and error bars represent 1 SD. (b) Flow cytometric cell cycle analysis of cyclin E–deregulated and control cells. Asynchronous cells transduced with c-Ad or E-Ad were subjected to a 15-min BrdU pulse before fixation and preparation for flow cytometric analysis. Abscissa indicates nuclear DNA content based on propidium iodide staining; ordinate indicates BrdU incorporation based on immunofluorescence. (c) Replication foci in early S phase cells with deregulated cyclin E. E-Ad– and c-Ad–transduced cells, respectively, were subjected to a 15-min BrdU pulse and labeled DNA was analyzed by immunofluorescence. Two representative early S phase cells from each population are shown. DAPI-stained DNA is shown in blue; incorporated BrdU is shown in green.
Figure 2.
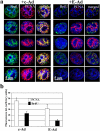
Titration of replication forks by PCNA staining in early S phase nuclei with deregulated cyclin E. c-Ad– and E-Ad–transduced cells were subjected to a 15-min BrdU pulse and were analyzed simultaneously for BrdU incorporation and chromatin-bound PCNA by immunofluorescence deconvolution microscopy. (a) Images of representative early S phase cells are shown. Red, PCNA; green, BrdU; blue, DNA (DAPI). (b) Histograms representing average values of integrated intensities (in arbitrary units) of nuclear staining shown in panel a. Error bars are equivalent to 1 SD.
Figure 3.
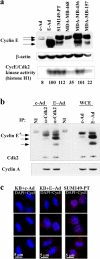
Status of cyclin E and cyclin A in adenovirus-transduced cells. (a) Levels of cyclin E and cyclin E–Cdk2 kinase activity in cancer-derived cell lines. Protein extracts were prepared from c-Ad– and E-Ad–transduced KB cells as well as from four breast cancer–derived cell lines (SUM149-PT, MDA-MB-468, MDA-MB-436, and MDA-MB-157). The same extracts were used for SDS-PAGE followed by immunoblotting (top panels) and immunoprecipitation for histone H1 kinase assay (bottom panel). Quantitation of cyclin E–Cdk2 kinase activity (32P incorporation) is shown. (b) Cyclin E and cyclin A association with Cdk2 in S phase cyclin E–transduced cells. c-Ad– and E-Ad–transduced cells were synchronized in S phase by treatment with thymidine. Cell lysates were subjected to immunoprecipitation using anti-Cdk2 antibody followed by SDS-PAGE and immunoblotting, or were analyzed directly by SDS-PAGE and immunoblotting. NI, nonimmune serum; WCE, whole-cell extract. Asterisk indicates principal isoform of endogenous cyclin E. (c) c-Ad– and E-Ad–transduced cells, as well as the SUM149PT breast cancer–derived cell line, were synchronized by thymidine block-release; telophase cells were analyzed in parallel for cyclin E level by immunofluorescence deconvolution microscopy. Images of representative telophase cells are shown. Red, cyclin E; blue, DNA (DAPI).
Figure 4.
Analysis of chromatin-bound Mcm4 in telophase cells with deregulated cyclin E. c-Ad– and E-Ad–transduced cells were synchronized by mitotic shake-off. At 1 h after mitosis, cells were either (a) directly fixed and analyzed for Mcm4 by immunofluorescence deconvolution microscopy or (b) subjected to mild detergent extraction before fixation and then analyzed for Mcm4 by immunofluorescence deconvolution microscopy. In parallel, E-Ad–transduced cells were incubated with the Cdk2 inhibitor roscovitine subsequent to mitotic shake-off. Images of representative telophase cells are shown for each population. Mcm4 is shown in red; DAPI staining of DNA is shown in blue.
Figure 5.
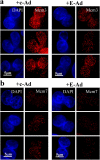
Analysis of chromatin-bound Mcm3 and Mcm7 in telophase cells with deregulated cyclin E. c-Ad– and E-Ad–transduced cells were synchronized by mitotic shake-off. At 1 h after mitosis, cells were subjected to mild detergent extraction, fixed, and analyzed for (a) Mcm3 and (b) Mcm7 by immunofluorescence deconvolution microscopy. Images of representative telophase cells are shown. Red, Mcm3, Mcm7; blue, DNA (DAPI).
Figure 6.
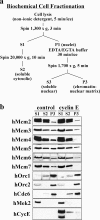
Chromatin loading of proteins associated with preRCs in cells with deregulated cyclin E. (a) c-Ad– and E-Ad–transduced cells were synchronized by mitotic shake-off. At 1 h after mitosis, cells were harvested and fractionated into a cytosolic supernatant (S2), a nuclear supernatant (S3), and a chromatin-enriched pellet (P3). (b) All fractions were separated by SDS-PAGE and were analyzed by Western blotting. Mek2 is used as a control for cytosolic localization, whereas Orc1 and Orc2 are controls for chromatin localization. Expression of cyclin E in the E-Ad–transduced population is also shown.
Figure 7.
Effects of deregulated cyclin E on chromatin association of MCM proteins as cells progress through G1 and in early S phase. c-Ad– and E-Ad–transduced cells were synchronized by nocodazole block and mitotic shake-off. At hourly intervals after mitosis, cells were harvested and fractionated as in Fig. 6. Western blotting of fractions separated by SDS-PAGE was performed with antibodies specific for Mcm2, Mcm3, Mcm4, Mcm5, Mcm6, Mcm7, Orc2, Mek2, and cyclin E. (a) Immunoblot of time course showing analysis of Mcm4, Orc2, Mek2, and cyclin E. (b) Quantitation of immunoblots of chromatin-bound fractions for MCM proteins relative to Orc2. The data are expressed as percentage of the maximal ratio observed during the time course. (c) c-Ad– and E-Ad–transduced cells were subjected to a 15-min BrdU pulse, and then were detergent extracted, fixed, and analyzed for BrdU incorporation and chromatin-bound Mcm4 by immunofluorescence microscopy. Typical early S phase cells were chosen based on BrdU focus pattern. Red, Mcm4; green, BrdU.
Figure 8.
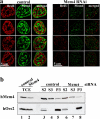
Partial reduction of Mcm4 expression by RNA interference results in impairment of DNA replication. (a) HeLa cells were transfected with firefly luciferase siRNA (left) or with Mcm4 siRNA (right), pulse labeled with BrdU, and analyzed by immunofluorescence microscopy after mild detergent extraction. Images of representative early S phase cell are shown. Green, Mcm4; red, BrdU. (b) HeLa cells transfected with firefly luciferase siRNA and Mcm4 siRNA as in panel a were fractionated into soluble and chromatin-enriched fractions as described in Fig. 6. Total cell extracts (TCE) as well as subcellular fractions were separated by SDS-PAGE and blots were probed with Mcm4 and Orc2 antibodies, respectively. Orc2 serves as a loading control for the chromatin-enriched fraction.
Figure 9.
Phosphorylation of Mcm4 in post-mitotic cells with deregulated cyclin E. (a) c-Ad– and E-Ad–transduced cells 1 h after mitosis were analyzed as described in Fig. 6 b, except that SDS-PAGE conditions were used that maximally separate phosphorylated Mcm4 species (10% acrylamide/bisacrylamide instead of 12.5%; longer run time). Orc2, Mek2, and Mcm4 are shown. (b) Aliquots of the S3 fractions shown in panel a were reanalyzed after treatment with alkaline phosphatase, in the absence or in the presence of an inhibitor.
Similar articles
- Mcm10 and the MCM2-7 complex interact to initiate DNA synthesis and to release replication factors from origins.
Homesley L, Lei M, Kawasaki Y, Sawyer S, Christensen T, Tye BK. Homesley L, et al. Genes Dev. 2000 Apr 15;14(8):913-26. Genes Dev. 2000. PMID: 10783164 Free PMC article. - Phosphorylation of minichromosome maintenance protein 7 (MCM7) by cyclin/cyclin-dependent kinase affects its function in cell cycle regulation.
Wei Q, Li J, Liu T, Tong X, Ye X. Wei Q, et al. J Biol Chem. 2013 Jul 5;288(27):19715-25. doi: 10.1074/jbc.M112.449652. Epub 2013 May 17. J Biol Chem. 2013. PMID: 23720738 Free PMC article. - Nascent transcription of MCM2-7 is important for nuclear localization of the minichromosome maintenance complex in G1.
Braun KA, Breeden LL. Braun KA, et al. Mol Biol Cell. 2007 Apr;18(4):1447-56. doi: 10.1091/mbc.e06-09-0792. Epub 2007 Feb 21. Mol Biol Cell. 2007. PMID: 17314407 Free PMC article. - How dormant origins promote complete genome replication.
Blow JJ, Ge XQ, Jackson DA. Blow JJ, et al. Trends Biochem Sci. 2011 Aug;36(8):405-14. doi: 10.1016/j.tibs.2011.05.002. Epub 2011 Jun 7. Trends Biochem Sci. 2011. PMID: 21641805 Free PMC article. Review. - MCM proteins in DNA replication.
Tye BK. Tye BK. Annu Rev Biochem. 1999;68:649-86. doi: 10.1146/annurev.biochem.68.1.649. Annu Rev Biochem. 1999. PMID: 10872463 Review.
Cited by
- Oncogenic stress sensitizes murine cancers to hypomorphic suppression of ATR.
Schoppy DW, Ragland RL, Gilad O, Shastri N, Peters AA, Murga M, Fernandez-Capetillo O, Diehl JA, Brown EJ. Schoppy DW, et al. J Clin Invest. 2012 Jan;122(1):241-52. doi: 10.1172/JCI58928. Epub 2011 Dec 1. J Clin Invest. 2012. PMID: 22133876 Free PMC article. - Model of DNA dynamics and replication.
Matsson L. Matsson L. J Biol Phys. 2005 Dec;31(3-4):303-21. doi: 10.1007/s10867-005-4635-1. J Biol Phys. 2005. PMID: 23345900 Free PMC article. - Prognostic value of cyclin E expression in breast cancer: a meta-analysis.
Gao S, Ma JJ, Lu C. Gao S, et al. Tumour Biol. 2013 Dec;34(6):3423-30. doi: 10.1007/s13277-013-0915-8. Epub 2013 Jun 18. Tumour Biol. 2013. PMID: 23775012 - An integrated view of cyclin E function and regulation.
Siu KT, Rosner MR, Minella AC. Siu KT, et al. Cell Cycle. 2012 Jan 1;11(1):57-64. doi: 10.4161/cc.11.1.18775. Epub 2012 Jan 1. Cell Cycle. 2012. PMID: 22186781 Free PMC article. - Synthetic Lethal Approaches Exploiting DNA Damage in Aggressive Myeloma.
Cottini F, Hideshima T, Suzuki R, Tai YT, Bianchini G, Richardson PG, Anderson KC, Tonon G. Cottini F, et al. Cancer Discov. 2015 Sep;5(9):972-87. doi: 10.1158/2159-8290.CD-14-0943. Epub 2015 Jun 16. Cancer Discov. 2015. PMID: 26080835 Free PMC article.
References
- Coverley, D., H.R. Wilkinson, and C.S. Downes. 1996. A protein kinase-dependent block to reinitiation of DNA replication in G2 phase in mammalian cells. Exp. Cell Res. 225:294–300. - PubMed
- Donnellan, R., I. Kleinschmidt, and R. Chetty. 2001. Cyclin E immunoexpression in breast ductal carcinoma: pathologic correlations and prognostic implications. Hum. Pathol. 32:89–94. - PubMed
Publication types
MeSH terms
Substances
Grants and funding
- R56 CA078343/CA/NCI NIH HHS/United States
- CA13106/CA/NCI NIH HHS/United States
- R01 CA078343/CA/NCI NIH HHS/United States
- P01 CA013106/CA/NCI NIH HHS/United States
- CA78343/CA/NCI NIH HHS/United States
LinkOut - more resources
Full Text Sources
Other Literature Sources
Miscellaneous

