IL-7 regulates basal homeostatic proliferation of antiviral CD4+T cell memory - PubMed (original) (raw)
IL-7 regulates basal homeostatic proliferation of antiviral CD4+T cell memory
Derek C Lenz et al. Proc Natl Acad Sci U S A. 2004.
Abstract
Heightened protection from infectious disease as conferred by vaccination or pathogen exposure relies on the effective generation and preservation of specific immunological memory. T cells are irreducibly required for the control of most viral infections, and maintenance of CD8(+)T cell memory is regulated by at least two cytokines, IL-7 and IL-15, which support survival (IL-7, IL-15) and basal homeostatic proliferation (IL-15) of specific CD8(+) memory T cells (T(M)). In contrast, the factors governing the homeostasis of pathogen-specific CD4(+)T(M) remain at present unknown. Here, we used a physiologic in vivo model system for viral infection to delineate homeostatic features and mechanisms of antiviral CD4(+)T(M) preservation in direct juxtaposition to CD8(+)T cell memory. Basal homeostatic proliferation is comparable between specific CD4(+) and CD8(+)T(M) and independent of immunodominant determinants and functional avidities but regulated in a tissue-specific fashion. IL-7, identified as the dominant cytokine, and IL-15, an accessory cytokine, regulate basal homeostatic proliferation and survival of antiviral CD4(+)T(M). Interestingly, a role for these cytokines in regulation of CD4(+)T cell memory is not readily discernible in the generic "memory-phenotype" population, apparently a consequence of its heterogeneous composition. We also describe a prominent, nonredundant role for IL-7 in supporting basal homeostatic proliferation of CD8(+)T(M). We propose that homeostatic control of antiviral CD4(+) and CD8(+) T cell memory is fundamentally similar and characterized by quantitative, rather than qualitative, differences.
Figures
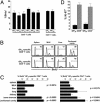
Fig. 1.
Phenotypic and functional profiling of CD4+ and CD8+TM.(A) Spleen cells from LCMV-immune mice (7–9 weeks after challenge) were restimulated for 5 h with the dominant MHC-I-restricted (GP33) or MHC-II-restricted (GP61) LCMV epitopes and stained for intracellular IFN-γ in combination with indicated surface or intracellular markers. (Upper) CD8+T cell gates. (Lower) CD4+T cell gates. Boxed numbers indicate frequencies of GP33-specifc CD8+ and GP61-specific CD4+TM; numbers in upper right quadrants are percentages of all epitope-specific (IFN-γ+) T cells coexpressing indicated additional markers. Values are means of 6–10 mice analyzed. TNFα, tumor necrosis factor α. GM-CSF, granulocyte/macrophage colony-stimulating factor. (B) Cytokine receptor expression by splenic TM. Black traces indicate staining for cytokine receptors; gray histograms are isotype control stains or polyclonal goat Ig stains (IL-15Rα histograms). (C) CD127/IL-7Rα, CD122/IL-2Rβ, and IL-15Rα expression by virus-specific CD8+ (black) and CD4+ (gray) TM in different organs. Cytokine receptor expression levels were normalized by dividing the geometric mean of fluorescence intensity (GMFI) of experimental stains by that of the isotype control stains. CD127 expression by specific CD4+TM was significantly higher as compared with specific CD8+TM in spleen (P = 0.0367) and lower in the MLN (P = 0.0011). Comparative CD122 expression by specific CD4+TM was reduced in all organs (P < 0.006), as was IL-15Rα expression (P < 0.02), with the exception of the peritoneal cavity.
Fig. 2.
Delineating basal homeostatic proliferation of CD4+ and CD8+TM.(A) Basal homeostatic proliferation of TM specific for MHC-I-restricted (GP33, NP396, GP276, GP118, NP205, and GP92) and MHC-II-restricted (GP61 and NP309) LCMV epitopes was evaluated ≈7 weeks after infection and 7-d BrdUrd administration before combined IFN-γ/BrdUrd staining. Bars (SEM) indicate the fraction of BrdUrd+TM among respective epitope-specific populations that are displayed in order of immunodominance. Experiment (n = three mice per group) was performed twice with similar results. (B) Histograms gated on GP33-specific CD8+TM (Upper) and GP61-specific CD4+TM (Lower) show percentage of BrdUrd incorporation (7-d pulse) by TM recovered from different tissues. (C) Summary of basal homeostatic proliferation (7-d BrdUrd pulse) as a function of anatomic location. Data (SEM; n = three mice per group) from one of three similar experiments. Statistical analyses for proliferative turnover in reference to spleen were performed by Student's t test; P values are indicated. (D) Ki-67 expression by virus-specific TM ≈10 weeks after LCMV challenge in spleen (black) and peritoneal cavity (gray). Shown are the combined data from two of four separate experiments (n = three mice per group; differences between Ki-67+ splenic and peritoneal TM, P < 0.001).
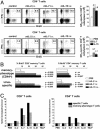
Fig. 3.
Cytokine-driven proliferation of TM. (A) Memory mice (6–9 weeks after infection) were injected with PBS (control) or 2 μg of recombinant murine IL-2, IL-7, or IL-15 and pulsed with BrdUrd for 3 d. Plots are gated on CD8+ (Upper)orCD4+ (Lower) T cells. Virus-specific TM are identified by IFN-γ stains. Additional controls included mice injected with mIL-17, which displayed BrdUrd uptake identical to PBS control mice. Boxed numbers indicate frequencies of GP33-specifc CD8+ and GP61-specific CD4+TM. Bar diagrams display absolute numbers of specific TM in spleen. Values indicate the factor by which cytokine administration increased specific TM numbers. No significant changes were noted after IL-2 administration. (B) Cytokine-driven proliferation of memory-phenotype (CD44hi) and specific TM as induced by i.v. administration of 2 μg of IL-2, IL-7, or IL-15. P values were calculated in relation to PBS-injected control mice. (C) The “factor increased turnover” after cytokine injection was calculated only for specific and memory-phenotype (CD44hi)TM populations that demonstrated significantly altered proliferation and is compared to proliferation in control mice (PBS injected, given a value of 1). Data in B and C are combined from four separate experiments evaluating three to nine mice total.
Fig. 4.
Regulation of TM proliferation by IL-7 and IL-15. (A) Enumeration of GP33-specific CD8+ and GP61-specific CD4+TM (≈9 weeks after LCMV) in spleens of control mice, mice receiving four separate i.v. injections of 450 μg of IL-7Rα-blocking antibody over a period of 7 d, and IL-15-/- mice. Shown are the representative data from one of four similar experiments, with error bars indicating SEM (n = three mice per group per experiment). (B) Basal homeostatic proliferation of GP33-specific CD8+ and GP61-specific CD4+TM in spleen, MLN, peritoneal cavity, and bone marrow in control mice and under conditions of IL-7Rα-blockade (4 × 450 μg of IL-7Rα antibody i.v.) or IL-15-deficiency (7-d BrdUrd pulse). To directly compare the relative impact of receptor blockade or cytokine deficiency, proliferation of respective TM populations in control mice (B6) was set to 100%; P values were calculated in comparison to respective TM populations in B6 control mice. Data are from one of two experiments (n = three mice per group); similar results were obtained by employing 3 × 300 μg of IL-7Rα antibody in two additional experiments. (C) Proliferation of GP33-specific CD8+ and GP61-specific CD4+TM under conditions of IL-7Rα-blockade (4 × 450 μg of IL-7Rα antibody i.v.) and/or IL-15-deficiency (7-d BrdUrd pulse). Values indicate the fraction of BrdUrd+ GP33- or GP61-specific TM. (D) Proliferation of GP33-specific CD8+ (Upper) and GP61-specific CD4+ (Lower)TM after treatment of B6 and B6.IL-15-/- mice (≈12 weeks after LCMV) with 2 μg of mIL-7 (3-d BrdUrd pulse). Consistent with the data displayed in B, proliferation of specific CD8+ but not CD4+TM was reduced in PBS-injected B6.IL-15-/- as compared with B6 control mice (data not shown).
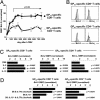
Fig. 5.
Regulation of TM survival by IL-7 and IL-15. (A) Bcl-2 expression by specific CD8+ and CD4+TM in peripheral blood as a function of time after virus challenge. Bcl-2 expression was normalized as indicated in the legend to Fig. 1_C_. (B) Up-regulation of Bcl-2 and Bcl-xL expression by specific CD8+ and CD4+TM (≈9 weeks after LCMV challenge) after 24 h in vitro treatment with 100 ng/ml mIL-7. Black traces represent data for mIL-7, and gray histograms represent data for PBS. (C) Summary of in vitro cytokine-induced Bcl-2 and Bcl-xL up-regulation by specific TM (100 ng/ml, 24-h stimulation); P values were calculated in comparison to respective TM populations in PBS-treated control cultures. (D) Ex vivo Bcl-2 expression by virus-specific TM 7 weeks after LCMV infection and under conditions of IL-7Rα-blockade (4 × 450 μg of antibody i.v. over 7 d) and/or IL-15-deficiency. Significant differences in Bcl-2 expression were also observed after administration of 4 × 300 μg of antibody (data not shown). Experiments (n = three mice per group) were performed four times; P values were calculated in comparison to respective TM populations from PBS-injected or uninjected control mice (B6).
Similar articles
- Interleukin (IL)-15 and IL-7 jointly regulate homeostatic proliferation of memory phenotype CD8+ cells but are not required for memory phenotype CD4+ cells.
Tan JT, Ernst B, Kieper WC, LeRoy E, Sprent J, Surh CD. Tan JT, et al. J Exp Med. 2002 Jun 17;195(12):1523-32. doi: 10.1084/jem.20020066. J Exp Med. 2002. PMID: 12070280 Free PMC article. - IL-7 administration alters the CD4:CD8 ratio, increases T cell numbers, and increases T cell function in the absence of activation.
Geiselhart LA, Humphries CA, Gregorio TA, Mou S, Subleski J, Komschlies KL. Geiselhart LA, et al. J Immunol. 2001 Mar 1;166(5):3019-27. doi: 10.4049/jimmunol.166.5.3019. J Immunol. 2001. PMID: 11207251 - Epigenetic Maintenance of Acquired Gene Expression Programs during Memory CD8 T Cell Homeostasis.
Abdelsamed HA, Zebley CC, Youngblood B. Abdelsamed HA, et al. Front Immunol. 2018 Jan 18;9:6. doi: 10.3389/fimmu.2018.00006. eCollection 2018. Front Immunol. 2018. PMID: 29403491 Free PMC article. Review. - Homeostasis of memory T cells.
Surh CD, Boyman O, Purton JF, Sprent J. Surh CD, et al. Immunol Rev. 2006 Jun;211:154-63. doi: 10.1111/j.0105-2896.2006.00401.x. Immunol Rev. 2006. PMID: 16824125 Review.
Cited by
- Bim mediates apoptosis of CD127(lo) effector T cells and limits T cell memory.
Wojciechowski S, Jordan MB, Zhu Y, White J, Zajac AJ, Hildeman DA. Wojciechowski S, et al. Eur J Immunol. 2006 Jul;36(7):1694-706. doi: 10.1002/eji.200635897. Eur J Immunol. 2006. PMID: 16761315 Free PMC article. - A conserved CXXC motif in CD3epsilon is critical for T cell development and TCR signaling.
Wang Y, Becker D, Vass T, White J, Marrack P, Kappler JW. Wang Y, et al. PLoS Biol. 2009 Dec;7(12):e1000253. doi: 10.1371/journal.pbio.1000253. Epub 2009 Dec 1. PLoS Biol. 2009. PMID: 19956738 Free PMC article. - Induction and function of virus-specific CD4+ T cell responses.
Whitmire JK. Whitmire JK. Virology. 2011 Mar 15;411(2):216-28. doi: 10.1016/j.virol.2010.12.015. Epub 2011 Jan 14. Virology. 2011. PMID: 21236461 Free PMC article. Review. - Memory phenotype CD4 T cells undergoing rapid, nonburst-like, cytokine-driven proliferation can be distinguished from antigen-experienced memory cells.
Younes SA, Punkosdy G, Caucheteux S, Chen T, Grossman Z, Paul WE. Younes SA, et al. PLoS Biol. 2011 Oct;9(10):e1001171. doi: 10.1371/journal.pbio.1001171. Epub 2011 Oct 11. PLoS Biol. 2011. PMID: 22022231 Free PMC article. - Memory CD4 T cells in influenza.
Zens KD, Farber DL. Zens KD, et al. Curr Top Microbiol Immunol. 2015;386:399-421. doi: 10.1007/82_2014_401. Curr Top Microbiol Immunol. 2015. PMID: 25005927 Free PMC article. Review.
References
- Sprent, J. & Surh, C. D. (2002) Annu. Rev. Immunol. 20, 551-579. - PubMed
- Ahmed, R. & Gray, D. (1996) Science 272, 54-60. - PubMed
- Zinkernagel, R. M. (2002) Curr. Opin. Immunol. 14, 523-536. - PubMed
- Whitton, J. L. & Oldstone, M. B. (2001) in Field's Virology, eds. Fields, B., Howley, P. M., Griffin, D. E., Lamb, R. A., Martin, M. A., Roizman, B., Straus, S. E. & Knipe, D. (Lippincott, Philadelphia), pp. 285-320.
Publication types
MeSH terms
Substances
Grants and funding
- CA38355/CA/NCI NIH HHS/United States
- AI21487/AI/NIAID NIH HHS/United States
- 00080/PHS HHS/United States
- DK58541/DK/NIDDK NIH HHS/United States
- AI46710/AI/NIAID NIH HHS/United States
- P01 AG001743/AG/NIA NIH HHS/United States
- AI45927/AI/NIAID NIH HHS/United States
- R01 AI045927/AI/NIAID NIH HHS/United States
- R01 AI046710/AI/NIAID NIH HHS/United States
- AI09484/AI/NIAID NIH HHS/United States
- R37 CA038355/CA/NCI NIH HHS/United States
- R01 DK058541/DK/NIDDK NIH HHS/United States
- R01 AI009484/AI/NIAID NIH HHS/United States
- AG01743/AG/NIA NIH HHS/United States
LinkOut - more resources
Full Text Sources
Other Literature Sources
Molecular Biology Databases
Research Materials


