Evaluation of myc E-box phylogenetic footprints in glycolytic genes by chromatin immunoprecipitation assays - PubMed (original) (raw)
Evaluation of myc E-box phylogenetic footprints in glycolytic genes by chromatin immunoprecipitation assays
Jung-whan Kim et al. Mol Cell Biol. 2004 Jul.
Abstract
Prediction of gene regulatory sequences using phylogenetic footprinting has advanced considerably but lacks experimental validation. Here, we report whether transcription factor binding sites predicted by dot plotting or web-based Trafac analysis could be validated by chromatin immunoprecipitation assays. MYC overexpression enhances glycolysis without hypoxia and hence may contribute to altered tumor metabolism. Because the full spectrum of glycolytic genes directly regulated by Myc is not known, we chose Myc as a model transcription factor to determine whether it binds target glycolytic genes that have conserved canonical Myc binding sites or E boxes (5'-CACGTG-3'). Conserved canonical E boxes in ENO1, HK2, and LDHA occur in 31- to 111-bp islands with high interspecies sequence identity (>65%). Trafac analysis revealed another region in ENO1 that corresponds to a murine region with a noncanonical E box. Myc bound all these conserved regions well in the human P493-6 B lymphocytes. We also determined whether Myc could bind nonconserved canonical E boxes found in the remaining human glycolytic genes. Myc bound PFKM, but it did not significantly bind GPI, PGK1, and PKM2. Binding to BPGM, PGAM2, and PKLR was not detected. Both GAPD and TPI1 do not have conserved E boxes but are induced and bound by Myc through regions with noncanonical E boxes. Our results indicate that Myc binds well to conserved canonical E boxes, but not nonconserved E boxes. However, the binding of Myc to unpredicted genomic regions with noncanonical E boxes reveals a limitation of phylogenetic footprinting. In aggregate, these observations indicate that Myc is an important regulator of glycolytic genes, suggesting that MYC plays a key role in a switch to glycolytic metabolism during cell proliferation or tumorigenesis.
Figures
FIG. 1.
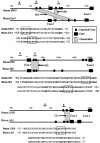
Locations of canonical E boxes in the human and mouse genomic sequences and phylogenetic footprinting analysis. Genomic sequences containing 5 kb upstream of the transcriptional start site through intron 1 were screened for the presence of the canonical E box. The positions of canonical E boxes and exons are mapped in the human (top of each pair) and mouse (bottom of each pair) genomic sequences. The maps show phylogenetically conserved canonical E boxes in ENO1, HK2, and LDHA genes. Conserved canonical E boxes were identified using the dot plot features of OMIGA software. Conservation of the canonical E box and its extended flanking region with more than 65% sequence identity for longer than 30 bp is indicated. The percentages of sequence identity between the two sequences are also indicated in the maps. Sequence alignments of the conserved E box and its extended flanking regions are shown below the maps. Canonical E boxes are boxed in each sequence alignment. Conserved nucleotides are shown in bold type. The regions that are amplified for the ChIP assay are indicated by the lines above the human gene and labeled A, B, or C in the maps.
FIG. 2.
(A) Organization of human and mouse glycolytic genes, which do not contain conserved canonical E-box regions. Mouse Gpi, Pfkm, and Pklr genes do not contain a canonical E box. The sequences in or around the canonical E boxes of BPGM, PFKM, PGAM2, PGK1, and PKM2 were not conserved. Note that most sequences for the mouse Pfkm promoter region are not available. (B) Organization of GAPD and TPI1 genes. Human GAPD and TPI1 genes do not contain a canonical E box. The regions that are amplified for the ChIP assay are indicated by the lines above the human gene and labeled A, B, or C.
FIG. 3.
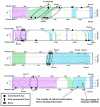
Trafac analysis (regulogram) of glycolytic genes. The phylogenetically conserved regions aligned with more than 50% identity are represented as different colored blocks. In each conserved region (indicated by a different color), the number of shared transcription factor binding sites (hits) and the percentage of sequence identity between human and mouse genomic sequences are indicated as two separate line graphs. For HK2, LDHA, and intronic E boxes of ENO1, conserved canonical E boxes identified by dot plot analysis (OMIGA software) as described in the legend to Fig. 1 consistently aligned in the Trafac analysis. Two human canonical E boxes in the promoter region of ENO1 correspond to the mouse noncanonical E box (5′-CACGCG-3′) in the same region. With PGK1, Trafac analysis detected a conserved intronic canonical E box.
FIG. 4.
(A) Western blot analysis of Myc expression in P493-6 cells left untreated (−) or treated (+) with tetracycline (Tet) for 72 h. (B) Western blot analysis of Myc expression in A1N4, human breast epithelial cells treated with 20 ng of EGF per ml. The number of hours after incubation with EGF is indicated. Tubulin is shown as a loading control in both panels.
FIG. 5.
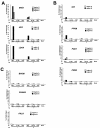
ChIP assay of glycolytic genes in the P493-6 cell system. Glycolytic genes displaying strong Myc binding (A), moderate or weak Myc binding (B), or no Myc binding (C) are shown. Labeled regions (as shown in Fig. 1; region A, B, or C) of each gene were quantitatively amplified by real-time PCR. PCR was performed on the fragmented chromatin precipitated from P493-6 cells left untreated (−) or treated (+) with tetracycline (Tet) for 72 h with anti-Myc or HGF, without antibody (no Ab), or mock control samples as indicated at the bottom of the graph. The white bars represent the percentage of total input of control regions (region A). The black and hatched bars represent the percentage of total input of the chromatin regions that contain conserved canonical E boxes (ENO1, HK2, and LDHA) or nonconserved canonical E boxes (BPGM, GPI, PFKM, PGAM2, PGK1, and PKM2).
FIG. 6.
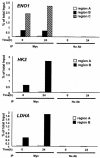
ChIP assay of glycolytic genes in the A1N4 cell system. Chromatin precipitated from A1N4 cells at the indicated times with anti-Myc antibody or without antibody (no Ab) were subjected to real-time PCR as described in the legend to Fig. 5.
FIG. 7.
Scanning ChIP assay of the human GAPD gene. (A) Locations of canonical E boxes, noncanonical E boxes, and exons in the human and mouse genomic sequences. Canonical E boxes in the mouse gene are indicated by black circles. The lead (+) or complement (−) sequences of noncanonical E boxes are also indicated. The regions that are amplified for the scanning ChIP assay are indicated by the lines above the human gene and labeled A to H. (B) The human GAPD gene was scanned by ChIP assay in the P493-6 cell system. P493-6 cells were either not treated (− Tet) or treated with tetracycline (+ Tet) for 72 h. ChIP was performed with anti-Myc or HGF, without antibody (no Ab), or mock control samples as indicated at the bottom of the graph.
FIG. 8.
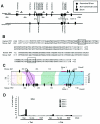
Phylogenetic footprinting analysis and scanning ChIP assay of TPI1. (A) Noncanonical E boxes and exons are indicated in the human and mouse genomic sequences. The lead (+) or complement (−) sequences of noncanonical E boxes are also indicated. One canonical E box in mouse intron 1 is indicated as a black circle. The dotted areas represent the conservation of the noncanonical E box and its extended flanking region with more than 65% sequence identity for longer than 30 bp. The percentage of sequence identity is also shown. The regions that are amplified for the scanning ChIP assay are indicated as the lines above the human gene and labeled A to E. (B) Sequence alignments of the conserved E box and its extended flanking regions are shown. Noncanonical E boxes are boxed in each sequence alignment. Conserved nucleotides are shown in bold type. (C) Trafac analysis (regulogram) of human and mouse genomic sequences. (D) Scanning ChIP assay of human TPI1 in P493-6 cell system. P493-6 cells were either not treated (− Tet) or treated with tetracycline (+ Tet) for 72 h. ChIP was performed with anti-Myc or HGF, without antibody (no Ab), or mock control samples as indicated at the bottom of the graph.
FIG. 9.
Regulation of the glycolytic gene network by HIF-1 and Myc. Arrows emanating from HIF-1 indicate regulation of specific glycolytic genes by HIF-1 in response to hypoxia. Arrows emanating from Myc are shown with different thicknesses. The thickest arrows represent strong binding by Myc, whereas dashed arrows represent diminished binding. HIF-1 is shown downstream of oncogenic Ras and Src as well as being negatively regulated by von Hippel-Lindau protein (pVHL).
Similar articles
- Genomic targets of the human c-Myc protein.
Fernandez PC, Frank SR, Wang L, Schroeder M, Liu S, Greene J, Cocito A, Amati B. Fernandez PC, et al. Genes Dev. 2003 May 1;17(9):1115-29. doi: 10.1101/gad.1067003. Epub 2003 Apr 14. Genes Dev. 2003. PMID: 12695333 Free PMC article. - Expression of the TAF4b gene is induced by MYC through a non-canonical, but not canonical, E-box which contributes to its specific response to MYC.
Teye K, Okamoto K, Tanaka Y, Umata T, Ohnuma M, Moroi M, Kimura H, Tsuneoka M. Teye K, et al. Int J Oncol. 2008 Dec;33(6):1271-80. Int J Oncol. 2008. PMID: 19020761 - Sequences flanking the E-box contribute to cooperative binding by c-Myc/Max heterodimers to adjacent binding sites.
Walhout AJ, van der Vliet PC, Timmers HT. Walhout AJ, et al. Biochim Biophys Acta. 1998 Apr 29;1397(2):189-201. doi: 10.1016/s0167-4781(97)00227-3. Biochim Biophys Acta. 1998. PMID: 9565685 - Impact of MYC in regulation of tumor cell metabolism.
Wahlström T, Henriksson MA. Wahlström T, et al. Biochim Biophys Acta. 2015 May;1849(5):563-9. doi: 10.1016/j.bbagrm.2014.07.004. Epub 2014 Jul 17. Biochim Biophys Acta. 2015. PMID: 25038584 Review. - Recent advances in searching c-Myc transcriptional cofactors during tumorigenesis.
Caforio M, Sorino C, Iacovelli S, Fanciulli M, Locatelli F, Folgiero V. Caforio M, et al. J Exp Clin Cancer Res. 2018 Sep 27;37(1):239. doi: 10.1186/s13046-018-0912-2. J Exp Clin Cancer Res. 2018. PMID: 30261904 Free PMC article. Review.
Cited by
- Reactive oxygen species produced by altered tumor metabolism impacts cancer stem cell maintenance.
Tuy K, Rickenbacker L, Hjelmeland AB. Tuy K, et al. Redox Biol. 2021 Aug;44:101953. doi: 10.1016/j.redox.2021.101953. Epub 2021 Mar 27. Redox Biol. 2021. PMID: 34052208 Free PMC article. Review. - cMyc-mediated activation of serine biosynthesis pathway is critical for cancer progression under nutrient deprivation conditions.
Sun L, Song L, Wan Q, Wu G, Li X, Wang Y, Wang J, Liu Z, Zhong X, He X, Shen S, Pan X, Li A, Wang Y, Gao P, Tang H, Zhang H. Sun L, et al. Cell Res. 2015 Apr;25(4):429-44. doi: 10.1038/cr.2015.33. Epub 2015 Mar 20. Cell Res. 2015. PMID: 25793315 Free PMC article. - Dysregulated glycolysis as an oncogenic event.
Mikawa T, LLeonart ME, Takaori-Kondo A, Inagaki N, Yokode M, Kondoh H. Mikawa T, et al. Cell Mol Life Sci. 2015 May;72(10):1881-92. doi: 10.1007/s00018-015-1840-3. Epub 2015 Jan 22. Cell Mol Life Sci. 2015. PMID: 25609364 Free PMC article. Review. - Tyrosine Kinase Signaling in Cancer Metabolism: PKM2 Paradox in the Warburg Effect.
Wiese EK, Hitosugi T. Wiese EK, et al. Front Cell Dev Biol. 2018 Jul 24;6:79. doi: 10.3389/fcell.2018.00079. eCollection 2018. Front Cell Dev Biol. 2018. PMID: 30087897 Free PMC article. Review. - Matrine Promotes Human Myeloid Leukemia Cells Apoptosis Through Warburg Effect Mediated by Hexokinase 2.
Lin G, Wu Y, Cai F, Li Z, Su S, Wang J, Cao J, Ma L. Lin G, et al. Front Pharmacol. 2019 Sep 24;10:1069. doi: 10.3389/fphar.2019.01069. eCollection 2019. Front Pharmacol. 2019. PMID: 31607919 Free PMC article.
References
- Berman, B. P., Y. Nibu, B. D. Pfeiffer, P. Tomancak, S. E. Celniker, M. Levine, G. M. Rubin, and M. B. Eisen. 2002. Exploiting transcription factor binding site clustering to identify cis-regulatory modules involved in pattern formation in the Drosophila genome. Proc. Natl. Acad. Sci. USA 99:757-762. - PMC - PubMed
Publication types
MeSH terms
Substances
Grants and funding
- CA57341/CA/NCI NIH HHS/United States
- LM07515/LM/NLM NIH HHS/United States
- T32GM07819/GM/NIGMS NIH HHS/United States
- R01 CA057341/CA/NCI NIH HHS/United States
- T32 HL007525/HL/NHLBI NIH HHS/United States
- T32HL07525/HL/NHLBI NIH HHS/United States
- CA51497/CA/NCI NIH HHS/United States
- R01 CA051497/CA/NCI NIH HHS/United States
- R37 CA051497/CA/NCI NIH HHS/United States
LinkOut - more resources
Full Text Sources
Other Literature Sources
Molecular Biology Databases
Research Materials
Miscellaneous
