A predominantly neolithic origin for Y-chromosomal DNA variation in North Africa - PubMed (original) (raw)
A predominantly neolithic origin for Y-chromosomal DNA variation in North Africa
Barbara Arredi et al. Am J Hum Genet. 2004 Aug.
Abstract
We have typed 275 men from five populations in Algeria, Tunisia, and Egypt with a set of 119 binary markers and 15 microsatellites from the Y chromosome, and we have analyzed the results together with published data from Moroccan populations. North African Y-chromosomal diversity is geographically structured and fits the pattern expected under an isolation-by-distance model. Autocorrelation analyses reveal an east-west cline of genetic variation that extends into the Middle East and is compatible with a hypothesis of demic expansion. This expansion must have involved relatively small numbers of Y chromosomes to account for the reduction in gene diversity towards the West that accompanied the frequency increase of Y haplogroup E3b2, but gene flow must have been maintained to explain the observed pattern of isolation-by-distance. Since the estimates of the times to the most recent common ancestor (TMRCAs) of the most common haplogroups are quite recent, we suggest that the North African pattern of Y-chromosomal variation is largely of Neolithic origin. Thus, we propose that the Neolithic transition in this part of the world was accompanied by demic diffusion of Afro-Asiatic-speaking pastoralists from the Middle East.
Figures
Figure A1
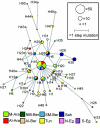
Network of haplogroup E3b2*(xE3b2a) microsatellite haplotypes in North Africa. Circles represent haplotypes; their areas are proportional to their frequencies in the total North African sample, and their colors indicate the population of origin. Population codes are reported in table 1 and fig. 1. Lines across the network branches represent haplotypes that were not observed.
Figure 1
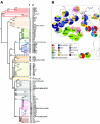
A, Phylogeny of Y-chromosomal haplogroups. The name of each haplogroup is shown at the tip of the lineage (1) according to Underhill et al. (2000) and (2) according to the Y Chromosome Consortium (2002). The polymorphisms screened in this study are shown along the branches. Lineage colors correspond to the haplogroup cluster colors of fig. 1_B_). Lineages shown by dashed lines were not observed in any of the populations discussed. Haplogroups observed in our samples are shown in boldface. The § symbol denotes 12f2a. B, Frequency distribution of Y haplogroup clusters in African, Middle Eastern, and European samples. Populations include the samples from table 1, as well as Moroccan Arabs (M-Ara), North Central Moroccan Berbers (NM-Ber), Saharawis (Sah), South Moroccan Berbers (SM-Ber) (Bosch et al. 2001); Sudanese (Sud), Ethiopians (Eth), Europeans (Europe), Malians (Mali), Central Africans (C-Afr), South Africans (S-Afr), Khoisan (Khoi), Middle Easterners (Mid-East) (Underhill et al. 2000); Ethiopian Jews (Eth-J), Mossi (Mossi), Rimaibe (Rim), Fali (Fali), Ouldeme (Ould), Bamileke (Bamil), and Ewondo (Ewo) (Cruciani et al. 2002).
Figure 2
Population gene diversity and haplogroup E3b2 frequency in North Africa as a function of longitude. The linear regressions of gene (i.e., haplogroup) diversity (grey line) and E3b2 frequency (black line) onto longitude are shown. The population codes are reported in table 1 and figure 1 (in italics for gene diversity and in roman type for E3b2 frequency).
Figure 3
MDS analyses based on binary marker genetic distances among the North African, sub-Saharan African, European, and Middle Eastern populations from fig. 1_B,_ tested using 116 binary markers (stress value 0.15). The population codes are reported in table 1 and figure 1.
Figure 4
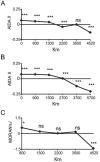
Spatial autocorrelation analyses. A, Correlogram of the AIDA II indices calculated for North Africa. B, Correlogram of the AIDA II indices for North Africa and the Middle East (Syrian, Turkish, and Lebanese samples of Semino et al. [2000]). C, Correlogram of the Moran’s I index for the haplogroup E3b2* (overall correlogram significance
_P_=.001
). ***,
P<.001
; ns, not significant.
Similar articles
- Sousse: extreme genetic heterogeneity in North Africa.
Fadhlaoui-Zid K, Garcia-Bertrand R, Alfonso-Sánchez MA, Zemni R, Benammar-Elgaaied A, Herrera RJ. Fadhlaoui-Zid K, et al. J Hum Genet. 2015 Jan;60(1):41-9. doi: 10.1038/jhg.2014.99. Epub 2014 Dec 4. J Hum Genet. 2015. PMID: 25471516 - A prehistory of Indian Y chromosomes: evaluating demic diffusion scenarios.
Sahoo S, Singh A, Himabindu G, Banerjee J, Sitalaximi T, Gaikwad S, Trivedi R, Endicott P, Kivisild T, Metspalu M, Villems R, Kashyap VK. Sahoo S, et al. Proc Natl Acad Sci U S A. 2006 Jan 24;103(4):843-8. doi: 10.1073/pnas.0507714103. Epub 2006 Jan 13. Proc Natl Acad Sci U S A. 2006. PMID: 16415161 Free PMC article. - Y-chromosome analysis in Egypt suggests a genetic regional continuity in Northeastern Africa.
Manni F, Leonardi P, Barakat A, Rouba H, Heyer E, Klintschar M, McElreavey K, Quintana-Murci L. Manni F, et al. Hum Biol. 2002 Oct;74(5):645-58. doi: 10.1353/hub.2002.0054. Hum Biol. 2002. PMID: 12495079 - A comparison of Y-chromosome variation in Sardinia and Anatolia is more consistent with cultural rather than demic diffusion of agriculture.
Morelli L, Contu D, Santoni F, Whalen MB, Francalacci P, Cucca F. Morelli L, et al. PLoS One. 2010 Apr 29;5(4):e10419. doi: 10.1371/journal.pone.0010419. PLoS One. 2010. PMID: 20454687 Free PMC article. - Dissecting the influence of Neolithic demic diffusion on Indian Y-chromosome pool through J2-M172 haplogroup.
Singh S, Singh A, Rajkumar R, Sampath Kumar K, Kadarkarai Samy S, Nizamuddin S, Singh A, Ahmed Sheikh S, Peddada V, Khanna V, Veeraiah P, Pandit A, Chaubey G, Singh L, Thangaraj K. Singh S, et al. Sci Rep. 2016 Jan 12;6:19157. doi: 10.1038/srep19157. Sci Rep. 2016. PMID: 26754573 Free PMC article.
Cited by
- The emergence of Y-chromosome haplogroup J1e among Arabic-speaking populations.
Chiaroni J, King RJ, Myres NM, Henn BM, Ducourneau A, Mitchell MJ, Boetsch G, Sheikha I, Lin AA, Nik-Ahd M, Ahmad J, Lattanzi F, Herrera RJ, Ibrahim ME, Brody A, Semino O, Kivisild T, Underhill PA. Chiaroni J, et al. Eur J Hum Genet. 2010 Mar;18(3):348-53. doi: 10.1038/ejhg.2009.166. Epub 2009 Oct 14. Eur J Hum Genet. 2010. PMID: 19826455 Free PMC article. - Y-chromosomal variation in sub-Saharan Africa: insights into the history of Niger-Congo groups.
de Filippo C, Barbieri C, Whitten M, Mpoloka SW, Gunnarsdóttir ED, Bostoen K, Nyambe T, Beyer K, Schreiber H, de Knijff P, Luiselli D, Stoneking M, Pakendorf B. de Filippo C, et al. Mol Biol Evol. 2011 Mar;28(3):1255-69. doi: 10.1093/molbev/msq312. Epub 2010 Nov 25. Mol Biol Evol. 2011. PMID: 21109585 Free PMC article. - Carriers of mitochondrial DNA macrohaplogroup L3 basal lineages migrated back to Africa from Asia around 70,000 years ago.
Cabrera VM, Marrero P, Abu-Amero KK, Larruga JM. Cabrera VM, et al. BMC Evol Biol. 2018 Jun 19;18(1):98. doi: 10.1186/s12862-018-1211-4. BMC Evol Biol. 2018. PMID: 29921229 Free PMC article. - Analysis of Y-chromosomal SNP haplogroups and STR haplotypes in an Algerian population sample.
Robino C, Crobu F, Di Gaetano C, Bekada A, Benhamamouch S, Cerutti N, Piazza A, Inturri S, Torre C. Robino C, et al. Int J Legal Med. 2008 May;122(3):251-5. doi: 10.1007/s00414-007-0203-5. Epub 2007 Oct 2. Int J Legal Med. 2008. PMID: 17909833 - Genetic diversity on the Comoros Islands shows early seafaring as major determinant of human biocultural evolution in the Western Indian Ocean.
Msaidie S, Ducourneau A, Boetsch G, Longepied G, Papa K, Allibert C, Yahaya AA, Chiaroni J, Mitchell MJ. Msaidie S, et al. Eur J Hum Genet. 2011 Jan;19(1):89-94. doi: 10.1038/ejhg.2010.128. Epub 2010 Aug 11. Eur J Hum Genet. 2011. PMID: 20700146 Free PMC article.
References
Electronic-Database Information
- AIDA: Autocorrelation Indices for DNA Analysis, http://web.unife.it/progetti/genetica/Giorgio/giorgio_soft.html
- Arlequin, http://lgb.unige.ch/arlequin/ (for population genetics software package)
- Fluxus Engineering, http://www.fluxus-engineering.com/sharenet.htm (for NETWORK 3.1.1.1 phylogenetic network analysis software)
- Ian Wilson’s download page, http://www.maths.abdn.ac.uk/~ijw/downloads/download.htm (for BATWING program)
- Y Chromosome Consortium, http://ycc.biosci.arizona.edu/nomenclature_system/frontpage.html
References
- Arioti M, Oxby C (1997) From hunter-fisher-gathering to herder-hunter-fisher-gathering in prehistoric times (Saharo-Sudanese region). Nomadic Peoples (New Ser) 1:98–119
- Bandelt HJ, Forster P, Röhl A (1999) Median-joining networks for inferring intraspecific phylogenies. Mol Biol Evol 16:37–48 - PubMed
- Barbujani G, Pilastro A, De Domenico S, Renfrew C (1994) Genetic variation in North Africa and Eurasia: Neolithic demic diffusion vs. Paleolithic colonisation. Am J Phys Anthropol 95:137–154 - PubMed
- Barker G (2003) Transitions to farming and pastoralism in North Africa. In: Bellwood P, Renfrew C (eds) Examining the farming/language dispersal hypothesis. McDonald Institute for Archaeological Research, Cambridge, United Kingdom, pp 151–161
Publication types
MeSH terms
LinkOut - more resources
Full Text Sources


