Widespread paleopolyploidy in model plant species inferred from age distributions of duplicate genes - PubMed (original) (raw)
. 2004 Jul;16(7):1667-78.
doi: 10.1105/tpc.021345. Epub 2004 Jun 18.
Affiliations
- PMID: 15208399
- PMCID: PMC514152
- DOI: 10.1105/tpc.021345
Widespread paleopolyploidy in model plant species inferred from age distributions of duplicate genes
Guillaume Blanc et al. Plant Cell. 2004 Jul.
Abstract
It is often anticipated that many of today's diploid plant species are in fact paleopolyploids. Given that an ancient large-scale duplication will result in an excess of relatively old duplicated genes with similar ages, we analyzed the timing of duplication of pairs of paralogous genes in 14 model plant species. Using EST contigs (unigenes), we identified pairs of paralogous genes in each species and used the level of synonymous nucleotide substitution to estimate the relative ages of gene duplication. For nine of the investigated species (wheat [Triticum aestivum], maize [Zea mays], tetraploid cotton [Gossypium hirsutum], diploid cotton [G. arboretum], tomato [Lycopersicon esculentum], potato [Solanum tuberosum], soybean [Glycine max], barrel medic [Medicago truncatula], and Arabidopsis thaliana), the age distributions of duplicated genes contain peaks corresponding to short evolutionary periods during which large numbers of duplicated genes were accumulated. Large-scale duplications (polyploidy or aneuploidy) are strongly suspected to be the cause of these temporal peaks of gene duplication. However, the unusual age profile of tandem gene duplications in Arabidopsis indicates that other scenarios, such as variation in the rate at which duplicated genes are deleted, must also be considered.
Figures
Figure 1.
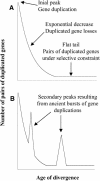
Theoretical Age Distributions of Pairs of Duplicated Genes in a Genome. (A) Age distribution of pairs of paralogs expected under constant rates of gene duplication and duplicated gene deletion. Three main phases can be outlined. An initial peak accounts for the most recently duplicated genes. The distribution then drops off after an exponential decrease because of the deletion of duplicated genes that are not under selective constraints. A long tail corresponds to older pairs of duplicates, where both genes evolve under selective constraints. (B) Age distribution of pairs of paralogs expected for a species that sustained two ancient large-scale duplication events. The overrepresentation of duplicated genes at periods corresponding to the large-scale duplication events gives rise to two secondary peaks.
Figure 2.
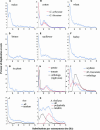
Distributions of the Fraction of Duplication Events as a Function of Their Levels of Synonymous Substitution for 14 Model Plant Species. Data was grouped into bins of 0.05 Ks units for graphing, except for wheat, where bins represent intervals of 0.03 Ks units (C). For G. hirsutum and G. arboreum (B), the Ks distributions of duplication events are shown in blue and red, respectively. For potato and tomato (H) and for soybean and M. truncatula (I), the Ks distribution of orthologs compared between the species is plotted (green line) as well as the paralog distributions within each species (blue and red lines). For rice and Arabidopsis ([J] and [K]), the distributions of all pairs of duplicated genes and pairs of tandem duplicates are shown in blue and green, respectively. The distribution of Arabidopsis duplicate genes resulting from the most recent polyploidy event (Blanc et al., 2003) is shown in red in (K).
Figure 3.
Frequency Distributions of Ks Values Obtained from Pairs of Duplicated Genes Identified in Unigene Data (Blue Line) and Complete Genome Sequence Data (Red Line) Are Essentially Identical. (A) Distributions of Ks values for Arabidopsis. (B) Distributions of Ks values for rice.
Figure 4.
Suspected Large-Scale Duplication Events Presented in Phylogenetic Context. The phylogenetic tree represents the currently accepted phylogeny of the plant species analyzed here (Soltis et al., 1999). Branch lengths are not to scale. The red ovals represent suspected large-scale duplication events (polyploidy or aneuploidy) recovered in this study. White ovals correspond to suspected polyploidy or aneuploidy events inferred in previous publications (see text for details) but not evidenced in our analysis. Estimated dates of duplication and speciation events are given in million years when available (from present or previous publications; see text). The question mark for the oldest large-scale duplication event of M. truncatula and soybean indicates that the phylogenetic position and the number of independent large-scale duplication events are still unclear.
Comment in
- Two genomes are better than one: widespread paleopolyploidy in plants and evolutionary effects.
Eckardt NA. Eckardt NA. Plant Cell. 2004 Jul;16(7):1647-9. doi: 10.1105/tpc.160710. Plant Cell. 2004. PMID: 15272471 Free PMC article. Review. No abstract available.
Similar articles
- Placing paleopolyploidy in relation to taxon divergence: a phylogenetic analysis in legumes using 39 gene families.
Pfeil BE, Schlueter JA, Shoemaker RC, Doyle JJ. Pfeil BE, et al. Syst Biol. 2005 Jun;54(3):441-54. doi: 10.1080/10635150590945359. Syst Biol. 2005. PMID: 16012110 - Dating and functional characterization of duplicated genes in the apple (Malus domestica Borkh.) by analyzing EST data.
Sanzol J. Sanzol J. BMC Plant Biol. 2010 May 14;10:87. doi: 10.1186/1471-2229-10-87. BMC Plant Biol. 2010. PMID: 20470375 Free PMC article. - Evolution of Gene Duplication in Plants.
Panchy N, Lehti-Shiu M, Shiu SH. Panchy N, et al. Plant Physiol. 2016 Aug;171(4):2294-316. doi: 10.1104/pp.16.00523. Epub 2016 Jun 10. Plant Physiol. 2016. PMID: 27288366 Free PMC article. Review. - Two evolutionarily distinct classes of paleopolyploidy.
Garsmeur O, Schnable JC, Almeida A, Jourda C, D'Hont A, Freeling M. Garsmeur O, et al. Mol Biol Evol. 2014 Feb;31(2):448-54. doi: 10.1093/molbev/mst230. Epub 2013 Dec 1. Mol Biol Evol. 2014. PMID: 24296661 - Gene duplication as a driver of plant morphogenetic evolution.
Rensing SA. Rensing SA. Curr Opin Plant Biol. 2014 Feb;17:43-8. doi: 10.1016/j.pbi.2013.11.002. Epub 2013 Nov 28. Curr Opin Plant Biol. 2014. PMID: 24507493 Review.
Cited by
- Origin, Evolution, and Diversification of the Expansin Family in Plants.
Wang Z, Cao J, Lin N, Li J, Wang Y, Liu W, Yao W, Li Y. Wang Z, et al. Int J Mol Sci. 2024 Nov 3;25(21):11814. doi: 10.3390/ijms252111814. Int J Mol Sci. 2024. PMID: 39519364 Free PMC article. - Expression and functional divergence of a type-A response regulator paralog pair formed by dispersed duplication during Populus deltoides evolution.
Lu J, Chen YN, Yin TM. Lu J, et al. Commun Biol. 2024 Oct 22;7(1):1367. doi: 10.1038/s42003-024-07091-8. Commun Biol. 2024. PMID: 39438601 Free PMC article. - Genome-Wide Characterization of the INDETERMINATE DOMAIN (IDD) Zinc Finger Gene Family in Solanum lycopersicum and the Functional Analysis of SlIDD15 in Shoot Gravitropism.
Wu H, Liu M, Fang Y, Yang J, Xie X, Zhang H, Zhou D, Zhou Y, He Y, Chen J, Bai Q. Wu H, et al. Int J Mol Sci. 2024 Sep 27;25(19):10422. doi: 10.3390/ijms251910422. Int J Mol Sci. 2024. PMID: 39408748 Free PMC article. - Chromatin Accessibility and Gene Expression Vary Between a New and Evolved Autopolyploid of Arabidopsis arenosa.
Srikant T, Gonzalo A, Bomblies K. Srikant T, et al. Mol Biol Evol. 2024 Oct 4;41(10):msae213. doi: 10.1093/molbev/msae213. Mol Biol Evol. 2024. PMID: 39404085 Free PMC article. - Genome-Wide Analysis of the Histone Modification Gene (HM) Family and Expression Investigation during Anther Development in Rice (Oryza sativa L.).
Huang Y, Liu J, Cheng L, Xu D, Liu S, Hu H, Ling Y, Yang R, Zhang Y. Huang Y, et al. Plants (Basel). 2024 Sep 6;13(17):2496. doi: 10.3390/plants13172496. Plants (Basel). 2024. PMID: 39273980 Free PMC article.
References
- Adams, M.D., et al. (1991). Complementary DNA sequencing: Expressed sequence tags and human genome project. Science 252, 1651–1656. - PubMed
- Arabidopsis Genome Initiative (2000). Analysis of the genome sequence of the flowering plant Arabidopsis thaliana. Nature 408, 796–815. - PubMed
- Aoki, N., Whitfeld, P., Hoeren, F., Scofield, G., Newell, K., Patrick, J., Offler, C., Clarke, B., Rahman, S., and Furbank, R.T. (2002). Three sucrose transporter genes are expressed in the developing grain of hexaploid wheat. Plant Mol. Biol. 50, 453–462. - PubMed
Publication types
MeSH terms
LinkOut - more resources
Full Text Sources
Research Materials


