A specific interface between integrin transmembrane helices and affinity for ligand - PubMed (original) (raw)
A specific interface between integrin transmembrane helices and affinity for ligand
Bing-Hao Luo et al. PLoS Biol. 2004 Jun.
Abstract
Conformational communication across the plasma membrane between the extracellular and intracellular domains of integrins is beginning to be defined by structural work on both domains. However, the role of the alpha and beta subunit transmembrane domains and the nature of signal transmission through these domains have been elusive. Disulfide bond scanning of the exofacial portions of the integrin alpha(IIbeta) and beta(3) transmembrane domains reveals a specific heterodimerization interface in the resting receptor. This interface is lost rather than rearranged upon activation of the receptor by cytoplasmic mutations of the alpha subunit that mimic physiologic inside-out activation, demonstrating a link between activation of the extracellular domain and lateral separation of transmembrane helices. Introduction of disulfide bridges to prevent or reverse separation abolishes the activating effect of cytoplasmic mutations, confirming transmembrane domain separation but not hinging or piston-like motions as the mechanism of transmembrane signaling by integrins.
Conflict of interest statement
The authors have declared that no conflicts of interest exist.
Figures
Figure 1. Sequences of the αIIb and β3 TM Regions
Segments predicted as TM by TMHMM version 2.0 (Krogh et al. 2001) are boxed. The more C-terminal KVGFF sequence in αIIb and KLLITI sequence in β3 are additionally predicted to be in the membrane by Armulik et al. (1999). Charged residues involved in intersub-unit salt bridges (dotted lines) in the NMR cytoplasmic domain structure (Vinogradova et al. 2002) are marked with ovals. Residues used for cysteine scanning in this study are indicated by heavy dots. Arrows show the boundary between residues forming disulfide bonds constitutively and after oxidation. The se-quences of the αIIb* GFFKR truncation and αIIb" GFFKR/GAAKR mutants are also shown.
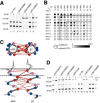
Figure 2. Formation of Intersubunit Disulfide Bonds in the TM Domain of Resting αIIbβ3
(A) 293T cells were transiently transfected with the indicated integrin constructs and metabolically labeled, and were untreated (–) or oxidized with Cu-phenanthroline on ice for 10 min (+), and then lysates were immunoprecipitated with mouse mAb 10E5 against αIIbβ3, followed by SDS-7.5% PAGE under nonreducing conditions and fluorography. Positions of molecular size markers are shown on the left. (B) Disulfide bond formation efficiency. For each residue pair, the radioactivity of the αβ heterodimer band divided by the total radioactivity (sum of α, β, and αβ bands) was used to calculate the disulfide bond formation efficiency and is depicted by a gray scale (white for 0% to black for 100% efficiency). The upper and lower halves of the circle indicate the efficiency before (constitutive) and after (oxidized) Cu-phenanthroline treatment at 0 °C, respectively. Residue pairs that form inducible disulfides (i.e., efficiency increases more than 10% after oxidation) are denoted by asterisks. Results are the mean of at least two independent experiments. Solid line shows the predicted TM boundary; dotted line indicates boundary between residues that form constitutive and inducible disulfide bonds. (C) Relative orientation of the αIIb and β3 TM helices near their N-terminal ends. The TM domains are depicted schematically as α helices, and experimental results from cysteine scanning were used to deduce their relative orientation. The resultant schematic model is shown in both top and side views. Residue pairs that form disulfide bonds at greater than 50% efficiency are connected by solid (constitutive disulfides) or dotted (inducible disulfides) red lines. The gray dotted line represents the boundary between residues that form constitutive and inducible disulfide bonds. Residues are color coded based on the number of constitutive or inducible disulfide bonds formed at greater than 50% efficiency: multiple bonds (interacting residues, red), only one bond (peripheral residues, pink), and no bonds (outside residues, blue). (D) Homodimer formation by the W967C mutant of αIIb. Transfection, radiolabeling, and immunoprecipitation was performed as in (A). Full-length αIIb with the W967C mutation (α-W967C) but not the truncated active mutant αIIb with W697C (α*-W967C) produced a homodimer band (α–α) larger than the heterodimer band (α–β). The α972C/βL697C combination that produces efficient inducible heterodimer is shown as a standard (lanes 1 and 2).
Figure 3. Disulfide-bonded Receptors Can Be Activated from Outside the Cell
Transiently transfected 293T cells expressing wild-type (αwt/βwt) or mutant αIIbβ3 heterodimers that form constitutive disulfide bonds (α965C/β693C and α968C/β693C) or are reported elsewhere to be activated (αwt/βG708N) (R. Li et al. 2003) were incubated with FITC-fibrinogen in a physiological buffer (control, white bars) or in the presence of 1 mM Mn2+ and the activating mAb PT25–2 (+Mn/PT25–2, black bars). Binding of FITC-fibrinogen was determined by flow cytometry as the mean fluorescence intensity and normalized by dividing by the mean fluorescence intensity with Cy3-labeled anti-β3 mAb AP3 and multiplying by 100.
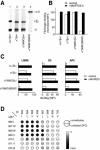
Figure 4. Formation of Intersubunit Disulfide Bonds in the TM Domain of αIIb*β3 and Effect on Ligand Binding and LIBS Epitopes
(A) Immunoprecipitation. Immunoprecipitation of [35S]-labeled receptors and nonreducing SDS-PAGE and fluorography was as described in Figure 2. (B) FITC-fibrinogen binding. Binding was determined by immunofluorescence as described in Figure 3. (C) LIBS exposure. Three different anti-LIBS mAbs (LIBS6, D3, and AP5) were used to probe the conformational state. mAb binding is expressed as the mean fluorescence intensity in the absence (control, open bars) or presence (+Mn/RGD, black bars) of Mn2+ and RGD peptide. (D) Disulfide bond formation efficiency. Disulfide bond formation in αIIb*β3 heterodimers with the indicated residues mutated to cysteine was determined as described in Figure 2B.
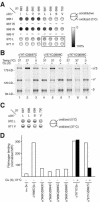
Figure 5. Formation of Intersubunit TM Disulfide Bonds in GFFKR/GAAKR Mutant αIIb′′β3 Receptors and Effect on Ligand Binding
(A) Disulfide bond formation efficiency in αIIb"β3. Disulfide bond formation in αIIb"β3 heterodimers with the indicated residues mutated to cysteine was determined as in Figure 2B. Boxed residue pairs were also subjected to Cu-phenanthroline oxidation at 37 °C in (B and C). (B) Radiolabeled 293T cells expressing the indicated mutant integrins were treated with Cu-phenanthroline at 0 °C or 37 °C, followed by immunoprecipitation with anti-αIIbβ3, SDS-PAGE, and fluorography to probe disulfide bond formation. (C) Efficiency of intramembranous disulfide bond formation in the context of the αIIb"β3 mutant receptor was assessed after Cu-phenanthroline oxidation at 0 °C or 37 °C and expressed as in Figure 2B. (D) FITC-fibrinogen binding. Binding was determined before (–) and after (+) Cu-phenanthroline oxidation at 37 °C and expressed as in Figure 3.
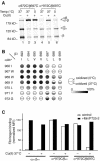
Figure 6. Formation of an Intersubunit Disulfide Bridge within the Membrane Reverses the Active Phenotype of the αIIb*β3 Receptor
(A) Radiolabeled 293T cells expressing the indicated mutant integrins were treated with Cu-phenanthroline at 0 °C or 37 °C, followed by immunoprecipitation with anti-αIIbβ3, SDS-PAGE, and fluorography to probe disulfide bond formation. (B) Efficiency of intramembranous disulfide bond formation in the context of the truncated αIIb*β3 receptor was assessed after Cu-phenanthroline oxidation at 0 °C or 37 °C and expressed as in Figure 2B. (C) Ligand binding by wild-type or mutant αIIb*β3 expressed on 293T cells was determined before (–) and after (+) Cu-phenanthroline oxidation at 37 °C and expressed as in Figure 3.
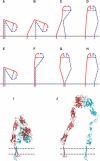
Figure 7. Model for Integrin Activation
The α and β subunits are red and blue, respectively. The membrane is shown as a solid gray line in (A–H) and as two dashed lines in (I and J). (A–H) Cartoon models. The ligand-binding α subunit β-propeller and β subunit I-like domains are symbolized as a semicircle with a shallow (low-affinity) or deep (high-affinity) ligand binding site. The headpiece additionally contains the α subunit thigh domain (red straight line) and the β subunit hybrid domain (blue straight line); the swing out of the latter is linked to ligand binding affinity. (A–D) Activation from within the cell initiated by TM domain separation. (E–H) Activation from outside the cell initiated by integrin extension, followed by ligand binding and finally TM domain separation. (I and J) Ribbon models. (I) Bent, low-affinity conformation corresponding to (A and E). (J) Extended, high-affinity conformation with the open headpiece corresponding to (D and H). Models are based on the TM domain association results described here, and negative stain electron microscopy (Takagi et al. 2002, 2003), crystallography (Xiong et al. 2001), NMR (Beglova et al. 2002; Vinogradova et al. 2002), and fluorescent resonance energy transfer (Kim et al. 2003). The TM and cytoplasmic domains are schematic, and show the proposed salt bridge (– and +).
Similar articles
- Dissociation of the α-subunit Calf-2 domain and the β-subunit I-EGF4 domain in integrin activation and signaling.
Wang W, Fu G, Luo BH. Wang W, et al. Biochemistry. 2010 Nov 30;49(47):10158-65. doi: 10.1021/bi101462h. Epub 2010 Nov 3. Biochemistry. 2010. PMID: 21038860 - "Inside-out" signal transduction inhibited by isolated integrin cytoplasmic domains.
Chen YP, O'Toole TE, Shipley T, Forsyth J, LaFlamme SE, Yamada KM, Shattil SJ, Ginsberg MH. Chen YP, et al. J Biol Chem. 1994 Jul 15;269(28):18307-10. J Biol Chem. 1994. PMID: 8034576 - Tests of integrin transmembrane domain homo-oligomerization during integrin ligand binding and signaling.
Wang W, Zhu J, Springer TA, Luo BH. Wang W, et al. J Biol Chem. 2011 Jan 21;286(3):1860-7. doi: 10.1074/jbc.M110.193797. Epub 2010 Nov 16. J Biol Chem. 2011. PMID: 21081497 Free PMC article. - Integrins in cell adhesion and signaling.
Akiyama SK. Akiyama SK. Hum Cell. 1996 Sep;9(3):181-6. Hum Cell. 1996. PMID: 9183647 Review. - Integrin regulation.
Ginsberg MH, Partridge A, Shattil SJ. Ginsberg MH, et al. Curr Opin Cell Biol. 2005 Oct;17(5):509-16. doi: 10.1016/j.ceb.2005.08.010. Curr Opin Cell Biol. 2005. PMID: 16099636 Review.
Cited by
- Talin activates integrins by altering the topology of the β transmembrane domain.
Kim C, Ye F, Hu X, Ginsberg MH. Kim C, et al. J Cell Biol. 2012 May 28;197(5):605-11. doi: 10.1083/jcb.201112141. J Cell Biol. 2012. PMID: 22641344 Free PMC article. - Consensus motif for integrin transmembrane helix association.
Berger BW, Kulp DW, Span LM, DeGrado JL, Billings PC, Senes A, Bennett JS, DeGrado WF. Berger BW, et al. Proc Natl Acad Sci U S A. 2010 Jan 12;107(2):703-8. doi: 10.1073/pnas.0910873107. Epub 2009 Dec 18. Proc Natl Acad Sci U S A. 2010. PMID: 20080739 Free PMC article. - A push-pull mechanism for regulating integrin function.
Li W, Metcalf DG, Gorelik R, Li R, Mitra N, Nanda V, Law PB, Lear JD, Degrado WF, Bennett JS. Li W, et al. Proc Natl Acad Sci U S A. 2005 Feb 1;102(5):1424-9. doi: 10.1073/pnas.0409334102. Epub 2005 Jan 25. Proc Natl Acad Sci U S A. 2005. PMID: 15671157 Free PMC article. - A helix heterodimer in a lipid bilayer: prediction of the structure of an integrin transmembrane domain via multiscale simulations.
Kalli AC, Hall BA, Campbell ID, Sansom MS. Kalli AC, et al. Structure. 2011 Oct 12;19(10):1477-84. doi: 10.1016/j.str.2011.07.014. Structure. 2011. PMID: 22000516 Free PMC article. - Linking integrin conformation to function.
Askari JA, Buckley PA, Mould AP, Humphries MJ. Askari JA, et al. J Cell Sci. 2009 Jan 15;122(Pt 2):165-70. doi: 10.1242/jcs.018556. J Cell Sci. 2009. PMID: 19118208 Free PMC article. Review.
References
- Armulik A, Nilsson I, von Heijne G, Johansson S. Determination of the border between the transmembrane and cytoplasmic domains of human integrin subunits. J Biol Chem. 1999;274:37030–37034. - PubMed
- Beglova N, Blacklow SC, Takagi J, Springer TA. Cysteine-rich module structure reveals a fulcrum for integrin rearrangement upon activation. Nat Struct Biol. 2002;9:282–287. - PubMed
- Buensuceso C, De Virgilio M, Shattil SJ. Detection of integrin αIIbβ3 clustering in living cells. J Biol Chem. 2003;278:15217–15224. - PubMed
Publication types
MeSH terms
Substances
LinkOut - more resources
Full Text Sources
Other Literature Sources

