Clustering analysis of SAGE data using a Poisson approach - PubMed (original) (raw)
Comparative Study
Clustering analysis of SAGE data using a Poisson approach
Li Cai et al. Genome Biol. 2004.
Abstract
Serial analysis of gene expression (SAGE) data have been poorly exploited by clustering analysis owing to the lack of appropriate statistical methods that consider their specific properties. We modeled SAGE data by Poisson statistics and developed two Poisson-based distances. Their application to simulated and experimental mouse retina data show that the Poisson-based distances are more appropriate and reliable for analyzing SAGE data compared to other commonly used distances or similarity measures such as Pearson correlation or Euclidean distance.
Figures
Figure 1
Graphs of clustering results for simulation data. The _x_-axis represents the different time points; the _y_-axis represents the expression level scaled as percentage. Data were normalized before plotting. For each tag, the count vector is rescaled to make the sum of the elements of the count vector equal 1. For example, b4 = (109,306,296,620,93) is rescaled to b4' = b4/θ where θ = (109 + 306 + 296 + 620 + 93).
Figure 2
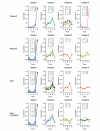
Graphs of clustering results for mouse retinal SAGE data. The _x_-axis represents the time points of the developing mouse retina SAGE libraries; the _y_-axis represents the relative frequency for each tag scaled as a percentage. Data were normalized before plotting. Each tag from the 10 libraries was rescaled to make the sum of all 10 tags equal to 1. Different colors represent different tags. See Additional data file 1 for more details.
Similar articles
- Clustering analysis of SAGE transcription profiles using a Poisson approach.
Huang H, Cai L, Wong WH. Huang H, et al. Methods Mol Biol. 2008;387:185-98. doi: 10.1007/978-1-59745-454-4_14. Methods Mol Biol. 2008. PMID: 18287632 - A Poisson-based adaptive affinity propagation clustering for SAGE data.
Tang D, Zhu Q, Yang F. Tang D, et al. Comput Biol Chem. 2010 Feb;34(1):63-70. doi: 10.1016/j.compbiolchem.2009.11.001. Epub 2009 Dec 29. Comput Biol Chem. 2010. PMID: 20042369 - Poisson-based self-organizing feature maps and hierarchical clustering for serial analysis of gene expression data.
Wang H, Zheng H, Azuaje F. Wang H, et al. IEEE/ACM Trans Comput Biol Bioinform. 2007 Apr-Jun;4(2):163-75. doi: 10.1109/TCBB.2007.070204. IEEE/ACM Trans Comput Biol Bioinform. 2007. PMID: 17473311 - Understanding SAGE data.
Wang SM. Wang SM. Trends Genet. 2007 Jan;23(1):42-50. doi: 10.1016/j.tig.2006.11.001. Epub 2006 Nov 15. Trends Genet. 2007. PMID: 17109989 Review. - Statistical evaluation of SAGE libraries: consequences for experimental design.
Ruijter JM, Van Kampen AH, Baas F. Ruijter JM, et al. Physiol Genomics. 2002 Oct 29;11(2):37-44. doi: 10.1152/physiolgenomics.00042.2002. Physiol Genomics. 2002. PMID: 12407185 Review.
Cited by
- LongSAGE analysis of skeletal muscle at three prenatal stages in Tongcheng and Landrace pigs.
Tang Z, Li Y, Wan P, Li X, Zhao S, Liu B, Fan B, Zhu M, Yu M, Li K. Tang Z, et al. Genome Biol. 2007;8(6):R115. doi: 10.1186/gb-2007-8-6-r115. Genome Biol. 2007. PMID: 17573972 Free PMC article. - Modeling SAGE tag formation and its effects on data interpretation within a Bayesian framework.
Gilchrist MA, Qin H, Zaretzki R. Gilchrist MA, et al. BMC Bioinformatics. 2007 Oct 18;8:403. doi: 10.1186/1471-2105-8-403. BMC Bioinformatics. 2007. PMID: 17945026 Free PMC article. - Global analysis of gene expression in mammalian kidney.
Soutourina O, Cheval L, Doucet A. Soutourina O, et al. Pflugers Arch. 2005 Apr;450(1):13-25. doi: 10.1007/s00424-004-1368-0. Epub 2004 Dec 21. Pflugers Arch. 2005. PMID: 15611884 Review. - A seriation approach for visualization-driven discovery of co-expression patterns in Serial Analysis of Gene Expression (SAGE) data.
Morozova O, Morozov V, Hoffman BG, Helgason CD, Marra MA. Morozova O, et al. PLoS One. 2008 Sep 12;3(9):e3205. doi: 10.1371/journal.pone.0003205. PLoS One. 2008. PMID: 18787709 Free PMC article. - Heritable clustering and pathway discovery in breast cancer integrating epigenetic and phenotypic data.
Wang Z, Yan P, Potter D, Eng C, Huang TH, Lin S. Wang Z, et al. BMC Bioinformatics. 2007 Feb 1;8:38. doi: 10.1186/1471-2105-8-38. BMC Bioinformatics. 2007. PMID: 17270052 Free PMC article.
References
- Velculescu VE, Zhang L, Vogelstein B, Kinzler KW. Serial analysis of gene expression. Science. 1995;270:484–487. - PubMed
- Buckhaults P, Zhang Z, Chen YC, Wang TL, St Croix B, Saha S, Bardelli A, Morin PJ, Polyak K, Hruban RH, et al. Identifying tumor origin using a gene expression-based classification map. Cancer Res. 2003;63:4144–4149. - PubMed
Publication types
MeSH terms
Grants and funding
- R01 HG02518-01/HG/NHGRI NIH HHS/United States
- P20 CA096470/CA/NCI NIH HHS/United States
- EY08064/EY/NEI NIH HHS/United States
- P20 CA96470/CA/NCI NIH HHS/United States
- R01 HG002518/HG/NHGRI NIH HHS/United States
- R01 EY008064/EY/NEI NIH HHS/United States
LinkOut - more resources
Full Text Sources

