Vectorial proteomics reveal targeting, phosphorylation and specific fragmentation of polymerase I and transcript release factor (PTRF) at the surface of caveolae in human adipocytes - PubMed (original) (raw)
Vectorial proteomics reveal targeting, phosphorylation and specific fragmentation of polymerase I and transcript release factor (PTRF) at the surface of caveolae in human adipocytes
Nabila Aboulaich et al. Biochem J. 2004.
Abstract
Caveolae, the specialized invaginations of plasma membranes, formed sealed vesicles with outwards-orientated cytosolic surface after isolation from primary human adipocytes. This morphology allowed differential, vectorial identification of proteins at the opposite membrane surfaces by proteolysis and MS. Extracellular-exposed caveolae-specific proteins CD36 and copper-containing amine oxidase were concealed inside the vesicles and resisted trypsin treatment. The cytosol-orientated caveolins were efficiently digested by trypsin, producing peptides amenable to direct MS sequencing. Isolation of peripheral proteins associated with the cytosolic surface of caveolae revealed a set of proteins that contained nuclear localization signals, leucine-zipper domains and PEST (amino acid sequence enriched in proline, glutamic acid, serine and threonine) domains implicated in regulation by proteolysis. In particular, PTRF (polymerase I and transcript release factor) was found as a major caveolae-associated protein and its co-localization with caveolin was confirmed by immunofluorescence confocal microscopy. PTRF was present at the surface of caveolae in the intact form and in five different truncated forms. Peptides (44 and 45 amino acids long) comprising both the PEST domains were sequenced by nanospray-quadrupole-time-of-flight MS from the full-length PTRF, but were not found in the truncated forms of the protein. Two endogenous cleavage sites corresponding to calpain specificity were identified in PTRF; one of them was in a PEST domain. Both cleavage sites were flanked by mono- or diphosphorylated sequences. The phosphorylation sites were localized to Ser-36, Ser-40, Ser-365 and Ser-366 in PTRF. Caveolae of human adipocytes are proposed to function in targeting, relocation and proteolytic control of PTRF and other PEST-domain-containing signalling proteins.
Figures
Figure 1. Characterization of caveolae purity
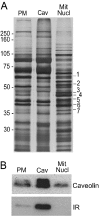
(A) Protein patterns in plasma-membrane (PM), caveolae (Cav) and mitochondrial/nuclear (Mit/Nucl) fractions revealed by SDS/PAGE and silver staining (5 μg of protein was loaded in each lane). Molecular-mass standards (kDa) are indicated. The protein band numbers on the right correspond to the numbers of identified proteins in Table 1. (B) Immunoblot analyses of the same cellular fractions (5 μg of protein) with antibodies against caveolin-1 (caveolin) or insulin receptor β-subunit (IR).
Figure 2. Proteolytic treatment of caveolae vesicles
(A) Protein pattern in isolated caveolae before and after treatment with trypsin, as indicated by − and + respectively (Coomassie Blue-stained gel; 8 μg of protein loaded). Positions of molecular-mass standards (kDa) are indicated. Two proteins that resisted tryptic treatment in caveolae are marked with their apparent molecular masses 100 and 70 kDa. (B) Immunoblot analysis of caveolae membrane proteins (3 μg of protein loaded) with antibodies against phosphotyrosine before and after treatment of the vesicles with trypsin, as indicated by − and + respectively. Caveolae were isolated from adipocytes that were stimulated with or without insulin, as indicated. Positions of insulin receptor (IR) and insulin receptor substrate 1 (IRS-1) are shown.
Figure 3. Analyses of caveolins exposed to the outer surface of caveolae vesicles
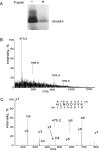
(A) Immunoblot analysis of caveolae proteins (3 μg of total protein loaded) with anti-caveolin-1 antibody before and after treatment of caveolae with trypsin, as indicated. (B) Full-scan ESI mass spectrum of the peptides released from the surface of caveolae vesicles by trypsin. (C) The product-ion spectrum of the doubly charged peptide ion with m/z 470.2 (also indicated in B) obtained by ESI and CID. The peptide fragment ions are represented as y (C-terminal) or b (N-terminal) fragments in the spectrum and are indicated in the shown peptide sequence obtained from the spectral data and corresponding to the sequence of caveolin-1.
Figure 4. Identification of caveolae-associated proteins
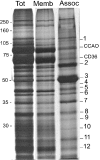
Caveolae vesicles isolated at mild ionic strength and pH conditions were stripped of their associated proteins with 0.5 M carbonate buffer (pH 11). Aliquots containing 5 μg of caveolae proteins before treatment with the carbonate buffer (Tot), the remaining membrane proteins (Memb) and the released proteins (Assoc) were subjected to SDS/PAGE and silver staining. Positions of molecular-mass standards (kDa) are indicated. The numbers on the right correspond to the bands of caveolae-associated proteins that have been identified and described in the same order as in Table 3. CCAO, copper-containing amine oxidase.
Figure 5. Structural similarities between five caveolae-associated proteins
Schematic representation of the domain structure of PTRF, SDPR, SRBC, EHD2 and R-Ras. Polypeptide modules are indicated as follows: LZ, leucine-zipper domain; PEST, PEST sequence; NLS, nuclear localization signal; EH, EHD; EF, calcium-binding motif. Numbers correspond to the first and last amino acids of the particular domain in the protein sequence. Solid and open arrows indicate non-tryptic cleavage sites and phosphorylated serine residues respectively in PTRF.
Figure 6. Distribution of PTRF in subcellular fractions
(A) Immunoblot analysis of mitochondrial/nuclear (Mit/Nucl), cytosol (Cyt), microsome (Mic), plasma-membrane (PM), caveolae (Cav) and caveolae-associated (Assoc) proteins (3 μg of protein loaded in each lane) with antibodies against PTRF. Positions of molecular-mass standards (kDa) are shown. Positions of PTRF fragments are indicated with arrows. (B) Immunoblot analysis of PM, Cav and Nucl proteins (2 μg of protein loaded) with antibodies against the nuclear membrane protein, nucleoporin-p62 (p62). (C) Immunoblot analysis of the same cellular fractions with antibodies against PTRF.
Figure 7. Co-localization of PTRF and caveolin in the plasma membrane of human adipocytes examined by immunofluorescence microscopy
The cytosolic surface of the plasma membrane was labelled with fluorescent antibodies against (A) PTRF (red) and (B) caveolin (green). (C) The superimposed images in (A) and (B) turn yellow where the red and green antibodies are co-localized.
Figure 8. The ESI–CID product-ion spectrum revealing N-terminal acetylation and the PEST sequence of PTRF
The selected quadruply charged peptide ion with m/z 1178.5 (indicated) was subjected to CID. The fragment y (C-terminal) and b (N-terminal) ions having charge state higher than +1 are marked with the corresponding superscript numbers. The sequence of the acetylated 45-amino-acid-long peptide is shown with the numbered fragment ions that were identified in the spectrum.
Figure 9. The ESI–CID product-ion spectra revealing non-tryptic cleavage sites and multiple phosphorylation of PTRF
The detected y (C-terminal) and b (N-terminal) ions are indicated in the spectra. The ions marked with asterisks indicate the fragments produced after neutral loss of H3PO4 (98 Da). (A) The doubly charged parent ion with m/z 481.6 is labelled in the spectrum along with the ion at m/z 432.6 produced after the neutral loss of 98 Da. The shown peptide sequence revealed from the spectrum corresponds to amino acids 363–370 in PTRF. The lower-case s indicates phosphorylation of Ser-365 in PTRF. (B) The doubly charged parent ion with m/z 521.6 is labelled in the spectrum along with the ions at m/z 472.6 and 423.6 produced after the single and double neutral losses of 98 Da respectively. The peptide sequence corresponds to amino acids 363–370 in PTRF, with phosphorylation of Ser-365 and Ser-366 indicated by the lower-case s. (C) The doubly charged parent ion with m/z 819.3 is labelled in the spectrum along with the ion at m/z 770.3 produced after the neutral loss of 98 Da. The peptide sequence corresponds to amino acids 31–45 in PTRF. The lower-case s indicates phosphorylation of Ser-40 in PTRF. (D) The parent ion with m/z 859.3 is labelled in the spectrum along with the ion at m/z 810.3 produced after the neutral loss of 98 Da. The peptide sequence corresponds to amino acids 31–45 in PTRF, with phosphorylation of Ser-36 and Ser-40 indicated by the lower-case s.
Similar articles
- Identification of a major protein on the cytosolic face of caveolae.
Vinten J, Johnsen AH, Roepstorff P, Harpøth J, Tranum-Jensen J. Vinten J, et al. Biochim Biophys Acta. 2005 Nov 10;1717(1):34-40. doi: 10.1016/j.bbamem.2005.09.013. Epub 2005 Oct 3. Biochim Biophys Acta. 2005. PMID: 16236245 - N-terminal processing and modifications of caveolin-1 in caveolae from human adipocytes.
Vainonen JP, Aboulaich N, Turkina MV, Strålfors P, Vener AV. Vainonen JP, et al. Biochem Biophys Res Commun. 2004 Jul 23;320(2):480-6. doi: 10.1016/j.bbrc.2004.05.196. Biochem Biophys Res Commun. 2004. PMID: 15219854 - Polymerase I and transcript release factor regulates lipolysis via a phosphorylation-dependent mechanism.
Aboulaich N, Chui PC, Asara JM, Flier JS, Maratos-Flier E. Aboulaich N, et al. Diabetes. 2011 Mar;60(3):757-65. doi: 10.2337/db10-0744. Epub 2011 Jan 31. Diabetes. 2011. PMID: 21282370 Free PMC article. - Vectorial proteomics.
Vener AV, Strålfors P. Vener AV, et al. IUBMB Life. 2005 Jun;57(6):433-40. doi: 10.1080/15216540500138360. IUBMB Life. 2005. PMID: 16012052 Review. - Caveola-forming proteins caveolin-1 and PTRF in prostate cancer.
Nassar ZD, Hill MM, Parton RG, Parat MO. Nassar ZD, et al. Nat Rev Urol. 2013 Sep;10(9):529-36. doi: 10.1038/nrurol.2013.168. Epub 2013 Aug 13. Nat Rev Urol. 2013. PMID: 23938946 Review.
Cited by
- A mechanosensitive caveolae-invadosome interplay drives matrix remodelling for cancer cell invasion.
Monteiro P, Remy D, Lemerle E, Routet F, Macé AS, Guedj C, Ladoux B, Vassilopoulos S, Lamaze C, Chavrier P. Monteiro P, et al. Nat Cell Biol. 2023 Dec;25(12):1787-1803. doi: 10.1038/s41556-023-01272-z. Epub 2023 Oct 30. Nat Cell Biol. 2023. PMID: 37903910 Free PMC article. - Dynamin2 functions as an accessory protein to reduce the rate of caveola internalization.
Larsson E, Morén B, McMahon KA, Parton RG, Lundmark R. Larsson E, et al. J Cell Biol. 2023 Apr 3;222(4):e202205122. doi: 10.1083/jcb.202205122. Epub 2023 Feb 2. J Cell Biol. 2023. PMID: 36729022 Free PMC article. - A Novel High-Throughput Screening Method for a Human Multicentric Osteosarcoma-Specific Antibody and Biomarker Using a Phage Display-Derived Monoclonal Antibody.
Hayashi T, Yamamoto N, Kurosawa G, Tajima K, Kondo M, Hiramatsu N, Kato Y, Tanaka M, Yamaguchi H, Kurosawa Y, Yamada H, Fujita N. Hayashi T, et al. Cancers (Basel). 2022 Nov 26;14(23):5829. doi: 10.3390/cancers14235829. Cancers (Basel). 2022. PMID: 36497311 Free PMC article. - Caveolar and non-Caveolar Caveolin-1 in ocular homeostasis and disease.
Enyong EN, Gurley JM, De Ieso ML, Stamer WD, Elliott MH. Enyong EN, et al. Prog Retin Eye Res. 2022 Nov;91:101094. doi: 10.1016/j.preteyeres.2022.101094. Epub 2022 Jun 18. Prog Retin Eye Res. 2022. PMID: 35729002 Free PMC article. Review. - Not Enough Fat: Mouse Models of Inherited Lipodystrophy.
Le Lay S, Magré J, Prieur X. Le Lay S, et al. Front Endocrinol (Lausanne). 2022 Feb 18;13:785819. doi: 10.3389/fendo.2022.785819. eCollection 2022. Front Endocrinol (Lausanne). 2022. PMID: 35250856 Free PMC article. Review.
References
- Razani B., Woodman S. E., Lisanti M. P. Caveolae: from cell biology to animal physiology. Pharmacol. Rev. 2002;54:431–467. - PubMed
- van Deurs B., Roepstorff K., Hommelgaard A. M., Sandvig K. Caveolae: anchored, multifunctional platforms in the lipid ocean. Trends Cell Biol. 2003;13:92–100. - PubMed
- Shaul P. W., Anderson R. G. Role of plasmalemmal caveolae in signal transduction. Am. J. Physiol. 1998;275:843–851. - PubMed
Publication types
MeSH terms
Substances
LinkOut - more resources
Full Text Sources
Molecular Biology Databases


