FtsZ exhibits rapid movement and oscillation waves in helix-like patterns in Escherichia coli - PubMed (original) (raw)
Comparative Study
FtsZ exhibits rapid movement and oscillation waves in helix-like patterns in Escherichia coli
Swapna Thanedar et al. Curr Biol. 2004.
Abstract
Prokaryotes contain cytoskeletal proteins such as the tubulin-like FtsZ, which forms the Z ring at the cell center for cytokinesis, and the actin-like MreB, which forms a helix along the long axis of the cell and is required for shape maintenance. Using time-lapse analysis of Escherichia coli cells expressing FtsZ-GFP, we found that FtsZ outside of the Z ring also localized in a helix-like pattern and moved very rapidly within this pattern. The movement occurred independently of the presence of Z rings and was most easily detectable in cells lacking Z rings. Moreover, we observed oscillation waves of FtsZ-GFP in the helix-like pattern, particularly in elongated cells, and the period of this oscillation was similar to that of the Min proteins. The MreB helix was not required for the rapid movement of FtsZ or the oscillation of MinD. The results suggest that FtsZ not only forms the Z ring but also is part of a highly dynamic, potentially helical cytoskeleton in bacterial cells.
Figures
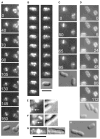
Figure 1. Non-Ring FtsZ Moves Rapidly in Helix-like Patterns
(A–C) Time-lapse series of EC488 (A and B) or EC448 (C) cells grown in 40 μM IPTG at 30°C (B) or 37°C (A and C) to express FtsZ-GFP; for each series, fluorescence images are shown with a DIC image shown last. In (A) and (C), the cell on the left has a stable Z ring, whereas the cell on the right has not yet assembled a Z ring and exhibits the rapidly moving helix-like patterns. (D) A time-lapse series of WM2024 cells expressing GFP-MreB shows that the MreB coils do not move appreciably over the time course. Cells were prepared as in (A–C). For (B), the time interval between images was approximately 5 s; elapsed times in s are shown for (A), (C), and (D). (E–G) Fixed wild-type TX3772 cells were examined by immunofluorescence with FtsZ antibody; shown are fluorescence (left panels) and corresponding DIC image (right panels). Arrows highlight what appear to be helix-like structures. Very bright foci are Z rings purposely overexposed in order to show the faint non-ring fluorescence patterns. (H) Uninduced EC448 cells. Scale bars represent 3 μm for (A–D), (H) (under [B]) and for (E–G) (under [G]).
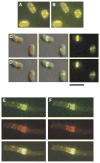
Figure 2. Difference Analysis of FtsZ-GFP Movement between Time Points
(A and B) In RGB mode, the 8 s panel from the GFP-MreB time-lapse series in Figure 1D was pseudocolored red and merged with the 24 s panel or the 112 s panel (pseudocolored green) to give rise to the merged images in (A) and (B), respectively. (C) The 0 and 50 s panels from the FtsZ-GFP time-lapse series in Figure 1C were pseudocolored red (left panel) and green (middle panel), respectively, and overlaid with the DIC image. The red and green images were then merged (right panel). (D) The 65 and 95 s panels from the FtsZ-GFP time-lapse series in Figure 1C were pseudocolored red (left panel) and green (middle panel), respectively, and overlaid with the DIC image. The red and green images were then merged (right panel). The cell with the Z ring on the left serves as a useful image alignment control. (E) Figure 3A panels 3 and 16, representing an interval of four complete FtsZ oscillation cycles, were pseudocolored green (top) and red (middle), respectively, and merged (bottom). (F) Same as (E), except with Panels 3 and 10, representing an interval of two complete FtsZ oscillation cycles. Yellow pixels in the merged images represent overlapping red and green pixels and indicate no gross changes in localization between the two time points. Green and red pixels in the merged images, on the other hand, indicate positions where fluorescence localization changed over time. Note that panels (A) and (B) feature mainly yellow pixels, suggesting little movement over time, whereas green and red dots in panels (E) and (F) indicate areas of low fluorescence overlap between the two time points. The central ring or helical structure serves as a useful alignment control in the merged image. The scale bar represents 3 μm.
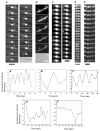
Figure 3. FtsZ Moves in MinD-like Oscillation Waves
(A) Time-lapse images of EC488 cells grown at 42°C to thermoinactivate the chromosomal copy of ftsZ84(ts) and supplemented with 40 μM IPTG to express FtsZ-GFP. Intervals between panels are 12–15 s. Arrows highlight the FtsZ-GFP oscillation. (B) Time-lapse images (approximately 25 s intervals) of a typical WM2012 filamentous cell grown for 2 hr at 37°C with 0.1% arabinose to induce synthesis of SulA + 60 μM IPTG to induce synthesis of FtsZ-GFP. Note that no Z rings were visible because of the action of SulA, yet the fluorescence still oscillated (arrows). (C) Time-lapse images of EC448 treated with 40 μg/ml cephalexin for 0.5 hr to inhibit late septation events. The Z rings were overexposed so that the dim fluorescence moving in an oscillatory manner (arrows) could be detected. (D) Time course of a typical segment of a WM1994 (Δ_minCDE::kan_ in EC448) cell expressing FtsZ-GFP at 30°C with 40 μM IPTG. A cell segment was used because most Δ_min_ cells are short filaments. Time intervals between frames were approximately 12 s. (E) Same as (D), except that a typical segment of a WM1993 cell (Δ_minCDE_ in EC488, with ftsZ84 on the chromosome) was used. The arrow highlights a transient helix-like segment. Cells containing Δ_min_ and ftsZ84 are highly filamentous even at 30°C because of a synthetic effect [24]. (A′–E′) Plots of differential peak fluorescence intensities between two adjacent cell segments (see Experimental Procedures); panels correspond to (A)–(E), respectively. The cell segments used for the plot were the right half minus the left half of cells in (A), (C), (D), and (E), and the right segment minus the middle of the filament in (B). Scale bars represent 3 μm.
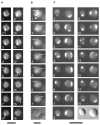
Figure 4. The MreB Helix Is Not Required for the Rapid Movement of FtsZ or MinD
(A and B). Time courses of FtsZ-GFP movement in cells lacking MreB (WM2002). For panel (A), images were taken 12–15 s apart. For panel (B), times elapsed were 0, 60, 120, 160, 180, 200, and 240 s, respectively, with a DIC image at the end. Arrows highlight the most visible fluorescent foci, which appeared to move in an oscillatory manner perpendicular to the division plane (most obvious in [B]). The arrowhead in (B) points to a FtsZ arc at the medial constriction site. (C) Time course of GFP-MinD movement in two WM1928 cells (Δ_mreB::cat_) at 8 s intervals, with a DIC image at the end. Note the complex localization patterns, including the assembly at multiple foci in panel 11. The scale bar for (A) represents 2 μm; that in (B) represents 3 μm; and that in (C) represents 5 μm.
Similar articles
- MinC N- and C-Domain Interactions Modulate FtsZ Assembly, Division Site Selection, and MinD-Dependent Oscillation in Escherichia coli.
LaBreck CJ, Conti J, Viola MG, Camberg JL. LaBreck CJ, et al. J Bacteriol. 2019 Jan 28;201(4):e00374-18. doi: 10.1128/JB.00374-18. Print 2019 Feb 15. J Bacteriol. 2019. PMID: 30455283 Free PMC article. - Assembly dynamics of FtsZ rings in Bacillus subtilis and Escherichia coli and effects of FtsZ-regulating proteins.
Anderson DE, Gueiros-Filho FJ, Erickson HP. Anderson DE, et al. J Bacteriol. 2004 Sep;186(17):5775-81. doi: 10.1128/JB.186.17.5775-5781.2004. J Bacteriol. 2004. PMID: 15317782 Free PMC article. - Colocalization of cell division proteins FtsZ and FtsA to cytoskeletal structures in living Escherichia coli cells by using green fluorescent protein.
Ma X, Ehrhardt DW, Margolin W. Ma X, et al. Proc Natl Acad Sci U S A. 1996 Nov 12;93(23):12998-3003. doi: 10.1073/pnas.93.23.12998. Proc Natl Acad Sci U S A. 1996. PMID: 8917533 Free PMC article. - Assembly dynamics of the bacterial MinCDE system and spatial regulation of the Z ring.
Lutkenhaus J. Lutkenhaus J. Annu Rev Biochem. 2007;76:539-62. doi: 10.1146/annurev.biochem.75.103004.142652. Annu Rev Biochem. 2007. PMID: 17328675 Review. - Z ring as executor of bacterial cell division.
Dajkovic A, Lutkenhaus J. Dajkovic A, et al. J Mol Microbiol Biotechnol. 2006;11(3-5):140-51. doi: 10.1159/000094050. J Mol Microbiol Biotechnol. 2006. PMID: 16983191 Review.
Cited by
- The Min system and other nucleoid-independent regulators of Z ring positioning.
Rowlett VW, Margolin W. Rowlett VW, et al. Front Microbiol. 2015 May 13;6:478. doi: 10.3389/fmicb.2015.00478. eCollection 2015. Front Microbiol. 2015. PMID: 26029202 Free PMC article. Review. - 3D-SIM super resolution microscopy reveals a bead-like arrangement for FtsZ and the division machinery: implications for triggering cytokinesis.
Strauss MP, Liew AT, Turnbull L, Whitchurch CB, Monahan LG, Harry EJ. Strauss MP, et al. PLoS Biol. 2012;10(9):e1001389. doi: 10.1371/journal.pbio.1001389. Epub 2012 Sep 11. PLoS Biol. 2012. PMID: 22984350 Free PMC article. - FtsZ does not initiate membrane constriction at the onset of division.
Daley DO, Skoglund U, Söderström B. Daley DO, et al. Sci Rep. 2016 Sep 9;6:33138. doi: 10.1038/srep33138. Sci Rep. 2016. PMID: 27609565 Free PMC article. - Two independent spiral structures control cell shape in Caulobacter.
Dye NA, Pincus Z, Theriot JA, Shapiro L, Gitai Z. Dye NA, et al. Proc Natl Acad Sci U S A. 2005 Dec 20;102(51):18608-13. doi: 10.1073/pnas.0507708102. Epub 2005 Dec 12. Proc Natl Acad Sci U S A. 2005. PMID: 16344481 Free PMC article. - Cell shape dynamics in Escherichia coli.
Reshes G, Vanounou S, Fishov I, Feingold M. Reshes G, et al. Biophys J. 2008 Jan 1;94(1):251-64. doi: 10.1529/biophysj.107.104398. Epub 2007 Aug 31. Biophys J. 2008. PMID: 17766333 Free PMC article.
References
- Addinall SG, Holland B. The tubulin ancestor, FtsZ, draughtsman, designer and driving force for bacterial cytokinesis. J Mol Biol. 2002;318:219–236. - PubMed
- Jones LJ, Carballido-Lopez R, Errington J. Control of cell shape in bacteria: helical, actin-like filaments in Bacillus subtilis. Cell. 2001;104:913–922. - PubMed
- Bi E, Lutkenhaus J. FtsZ ring structure associated with division in Escherichia coli. Nature. 1991;354:161–164. - PubMed
Publication types
MeSH terms
Substances
LinkOut - more resources
Full Text Sources
Other Literature Sources
Molecular Biology Databases


