Expanded dynamic range of fluorescent indicators for Ca(2+) by circularly permuted yellow fluorescent proteins - PubMed (original) (raw)
Expanded dynamic range of fluorescent indicators for Ca(2+) by circularly permuted yellow fluorescent proteins
Takeharu Nagai et al. Proc Natl Acad Sci U S A. 2004.
Abstract
Fluorescence resonance energy transfer (FRET) technology has been used to develop genetically encoded fluorescent indicators for various cellular functions. Although most indicators have cyan- and yellow-emitting fluorescent proteins (CFP and YFP) as FRET donor and acceptor, their poor dynamic range often prevents detection of subtle but significant signals. Here, we optimized the relative orientation of the two chromophores in the Ca(2+) indicator, yellow cameleon (YC), by fusing YFP at different angles. We generated circularly permuted YFPs (cpYFPs) that showed efficient maturation and acid stability. One of the cpYFPs incorporated in YC absorbs a great amount of excited energy from CFP in its Ca(2+)-saturated form, thereby increasing the Ca(2+)-dependent change in the ratio of YFP/CFP by nearly 600%. Both in cultured cells and in the nervous system of transgenic mice, the new YC enables visualization of subcellular Ca(2+) dynamics with better spatial and temporal resolution than before. Our study provides an important guide for the development and improvement of indicators using GFP-based FRET.
Figures
Fig. 1.
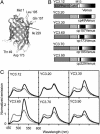
Schematic structures and spectral properties of YC3.12 and the new YC variants. (A) The three-dimensional structure of GFP with the positions of the original (Met-1) and new N termini (Thr-49, Gln-157, Asp-173, Leu-195, and Ile-229) are indicated. (B) Domain structures of YC3.12, YC3.20, YC3.30, YC3.60, YC3.70, and YC3.90. XCaM, Xenopus CaM; E104Q, mutation of the conserved bidentate glutamate (E104) at position 12 of the third Ca2+ binding loop to glutamine. (C) Emission spectra of YC variants (excitation at 435 nm) at zero (dotted line) and saturated Ca2+ (solid line).
Fig. 2.
Properties of YC variants in vitro.(A) Fluorescence anisotropy of YC variants (YC3.12, YC3.20, YC3.30, YC3.60, YC3.70, and YC3.900) at zero and saturated Ca2+. (B) Ca2+ titration curves of YC2.60 (triangles), YC3.60 (circles), and YC4.60 (squares) at pH 7.4. (C) pH titration curves of YC3.60 at zero and saturated Ca2+.
Fig. 3.
Comparative measurements of Ca2+ dynamics in HeLa cells expressing YC3.60 and YC3.12. (A and B) Typical Ca2+ transients reported by YC3.60 (A) and YC3.12 (B) in HeLa cells induced with 30 μM ATP. (Upper) Changes in emission ratios (535/480 nm) with _R_max and _R_min values (indicated by solid and open arrowheads, respectively). (B Inset) The same graph with the ordinate expanded. (Lower) Changes in fluorescence intensities of CFP and cp173Venus (A), and CFP and Venus (B). The sampling interval was 5 s.
Fig. 4.
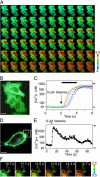
Confocal Ca2+ imaging in cytosol and beneath the plasma membrane by using YC3.60 and YC3.60pm, respectively. (A) A series of confocal pseudocolored ratio images showing propagation of [Ca2+]c. These images were taken at video rate. (B) A real-color image of the HeLa cells. In the top cell, six regions of interest (ROIs) were placed for measuring the propagation speed. (Scale bar = 10 μm.) (C) Time courses of changes in [Ca2+]c in the six ROIs indicated in B. _R_max and _R_min are indicated by a solid and an open arrowhead, respectively. The left-hand ordinate calibrates [Ca2+]c in nM. A black horizontal bar indicates the time during which the ratio images are shown in A. (D) A real-color image of a HeLa cell expressing YC3.60pm. (Scale bar = 5 μm.) (E) The histamine-induced change in [Ca2+]pm in the peripheral region indicated by a circle in D. _R_max and _R_min are indicated by a solid and an open arrowhead, respectively. The left-hand ordinate calibrates [Ca2+]pm in nM. (F) A series of confocal pseudocolored ratio images showing changes in [Ca2+]pm in filopodial structures.
Fig. 5.
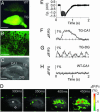
Fast Ca2+ imaging of a hippocampal brain slice from a YC3.60pm-producing transgenic mouse. (A) A low-magnification image of brains of a WT mouse and a transgenic line (no. 62) (TG). A 480DF30 excitation filter and a 535AF25 emission filter were used. (Scale bar = 0.5 mm.) (B) A high-magnification fluorescence image in the CA1 region of the transgenic mouse. (Scale bar = 50 μm.) (C) A bright-field image of hippocampal slice. Electrodes for stimulation (stim) and field recording (f.p.) are described by broken lines. (Scale bar = 0.2 mm). (D) A series of pseudocolored images showing a Ca2+ transient. The number in each image shows the time after the start of imaging. Two regions of interest were selected within regions CA1 and DG. (E) The field potential (f.p.) change induced by tetanus. (F) The time course of [Ca2+]pm observed in area CA1 of the transgenic line. (G) The time course of [Ca2+]pm observed in area DG of the transgenic line. (H) The time course of [Ca2+]pm observed in area CA1 of a WT mouse. (E–H) Averaged traces from eight challenges.
Similar articles
- Flow cytometric measurement of fluorescence (Förster) resonance energy transfer from cyan fluorescent protein to yellow fluorescent protein using single-laser excitation at 458 nm.
He L, Bradrick TD, Karpova TS, Wu X, Fox MH, Fischer R, McNally JG, Knutson JR, Grammer AC, Lipsky PE. He L, et al. Cytometry A. 2003 May;53(1):39-54. doi: 10.1002/cyto.a.10037. Cytometry A. 2003. PMID: 12701131 - Quantifying the influence of yellow fluorescent protein photoconversion on acceptor photobleaching-based fluorescence resonance energy transfer measurements.
Seitz A, Terjung S, Zimmermann T, Pepperkok R. Seitz A, et al. J Biomed Opt. 2012 Jan;17(1):011010. doi: 10.1117/1.JBO.17.1.011010. J Biomed Opt. 2012. PMID: 22352644 - New red-fluorescent calcium indicators for optogenetics, photoactivation and multi-color imaging.
Oheim M, van 't Hoff M, Feltz A, Zamaleeva A, Mallet JM, Collot M. Oheim M, et al. Biochim Biophys Acta. 2014 Oct;1843(10):2284-306. doi: 10.1016/j.bbamcr.2014.03.010. Epub 2014 Mar 27. Biochim Biophys Acta. 2014. PMID: 24681159 Review. - Measurements of the free luminal ER Ca(2+) concentration with targeted "cameleon" fluorescent proteins.
Demaurex N, Frieden M. Demaurex N, et al. Cell Calcium. 2003 Aug;34(2):109-19. doi: 10.1016/s0143-4160(03)00081-2. Cell Calcium. 2003. PMID: 12810053 Review.
Cited by
- New sensors for quantitative measurement of mitochondrial Zn(2+).
Park JG, Qin Y, Galati DF, Palmer AE. Park JG, et al. ACS Chem Biol. 2012 Oct 19;7(10):1636-40. doi: 10.1021/cb300171p. Epub 2012 Aug 10. ACS Chem Biol. 2012. PMID: 22850482 Free PMC article. - Topological specificity and hierarchical network of the circadian calcium rhythm in the suprachiasmatic nucleus.
Enoki R, Kuroda S, Ono D, Hasan MT, Ueda T, Honma S, Honma K. Enoki R, et al. Proc Natl Acad Sci U S A. 2012 Dec 26;109(52):21498-503. doi: 10.1073/pnas.1214415110. Epub 2012 Dec 4. Proc Natl Acad Sci U S A. 2012. PMID: 23213253 Free PMC article. - General Anesthetic Conditions Induce Network Synchrony and Disrupt Sensory Processing in the Cortex.
Lissek T, Obenhaus HA, Ditzel DA, Nagai T, Miyawaki A, Sprengel R, Hasan MT. Lissek T, et al. Front Cell Neurosci. 2016 Apr 14;10:64. doi: 10.3389/fncel.2016.00064. eCollection 2016. Front Cell Neurosci. 2016. PMID: 27147963 Free PMC article. - Ethylene-independent signaling by the ethylene precursor ACC in Arabidopsis ovular pollen tube attraction.
Mou W, Kao YT, Michard E, Simon AA, Li D, Wudick MM, Lizzio MA, Feijó JA, Chang C. Mou W, et al. Nat Commun. 2020 Aug 14;11(1):4082. doi: 10.1038/s41467-020-17819-9. Nat Commun. 2020. PMID: 32796832 Free PMC article. - Design, synthesis, and characterization of graphene-nanoparticle hybrid materials for bioapplications.
Yin PT, Shah S, Chhowalla M, Lee KB. Yin PT, et al. Chem Rev. 2015 Apr 8;115(7):2483-531. doi: 10.1021/cr500537t. Epub 2015 Feb 18. Chem Rev. 2015. PMID: 25692385 Free PMC article. Review.
References
- Miyawaki, A., Llopis, J., Heim, R., McCaffery, J. M., Adams, J. A., Ikura, M. & Tsien, R. Y. (1997) Nature 388, 882–887. - PubMed
- Tsien, R. Y. (1998) Annu. Rev. Biochem. 67, 509–544. - PubMed
- Griesbeck, O., Baird, G. S., Campbell, R. E., Zacharias, D. A. & Tsien, R. Y. (2001) J. Biol. Chem. 276, 29188–29194. - PubMed
- Nagai, T., Ibata, K., Park, E. S., Kubota, M., Mikoshiba, K. & Miyawaki, A. (2002) Nat. Biotechnol. 20, 87–90. - PubMed
Publication types
MeSH terms
Substances
LinkOut - more resources
Full Text Sources
Other Literature Sources
Research Materials
Miscellaneous


