REN(KCTD11) is a suppressor of Hedgehog signaling and is deleted in human medulloblastoma - PubMed (original) (raw)
. 2004 Jul 20;101(29):10833-8.
doi: 10.1073/pnas.0400690101. Epub 2004 Jul 12.
Elisabetta Ferretti, Enrico De Smaele, Beatrice Argenti, Claudia Mincione, Francesca Zazzeroni, Rita Gallo, Laura Masuelli, Maddalena Napolitano, Marella Maroder, Andrea Modesti, Felice Giangaspero, Isabella Screpanti, Edoardo Alesse, Alberto Gulino
Affiliations
- PMID: 15249678
- PMCID: PMC490020
- DOI: 10.1073/pnas.0400690101
REN(KCTD11) is a suppressor of Hedgehog signaling and is deleted in human medulloblastoma
Lucia Di Marcotullio et al. Proc Natl Acad Sci U S A. 2004.
Abstract
Hedgehog signaling is suggested to be a major oncogenic pathway in medulloblastoma, which arises from aberrant development of cerebellar granule progenitors. Allelic loss of chromosome 17p has also been described as the most frequent genetic defect in this human neoplasia. This observation raises the question of a possible interplay between 17p deletion and the Hedgehog tumorigenic pathway. Here, we identify the human orthologue of mouse REN(KCTD11), previously reported to be expressed in differentiating and low proliferating neuroblasts. Human REN(KCTD11) maps to 17p13.2 and displays allelic deletion as well as significantly reduced expression in medulloblastoma. REN(KCTD11) inhibits medulloblastoma cell proliferation and colony formation in vitro and suppresses xenograft tumor growth in vivo. REN(KCTD11) seems to inhibit medulloblastoma growth by negatively regulating the Hedgehog pathway because it antagonizes the Gli-mediated transactivation of Hedgehog target genes, by affecting Gli1 nuclear transfer, and its growth inhibitory activity is impaired by Gli1 inactivation. Therefore, we identify REN(KCTD11) as a suppressor of Hedgehog signaling and suggest that its inactivation might lead to a deregulation of the tumor-promoting Hedgehog pathway in medulloblastoma.
Figures
Fig. 1.
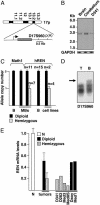
REN is haploinsufficient in medulloblastoma. (A) Schematic representation of human REN locus. (B) Northern blot of REN transcripts in human adult whole brain and cerebellum and D341 MB cells. (C) Q-PCR of REN allele copy number (mean ± SD) in primary human MB (n, number of cases tested; B, blood) and REN hemizygous (D341, D283, Med3, and Med8S) and diploid (Daoy and Med1) MB cell lines. The assay for Math1, on 4q22, shows the preservation of tumor diploidy. (D) Loss of heterozygosity analysis of D17S960 microsatellite in a representative REN hemizygous patient (T, tumor specimen; B, paired blood), showing allelic loss (arrow). (E) Expression of REN mRNA in normal cerebellum (N) [(n = 5, from normal tissue, peritumoral; Clontech or Ambion (Austin, TX)], primary MB (diploid, n = 7; hemizygous, n = 9), and MB cell lines was assayed by RT-Q-PCR, normalized with GAPDH expression (mean arbitrary units ± SD). P < 0.01 (hemizygous MB vs. normal cerebellum and vs. diploid MB). P < 0.02 (diploid MB vs. normal cerebellum) (by Mann–Whitney test).
Fig. 2.
REN suppresses in vitro growth and in vivo tumorigenicity of MB cells. (A) _All_-trans retinoic acid (1 μM) (Sigma) increases REN mRNA levels (assayed by RT-Q-PCR) in D283 cells. (B and C) BrdUrd-incorporating cells (mean ± SD from three experiments) 24 h after transfection with pEGFP or Myc-tagged REN (WT) or its deletion mutants (ΔPOZ and ΔC). (D) Colonyforming assay of Daoy cells transfected with empty pcDNA (CTR) or myc-tagged REN (WT) or ΔPOZ-REN (ΔPOZ) vectors [average (± SD) percentages of colonies, from two triplicate experiments]. (Lower) Western blot analysis of cell lysates 24 h after transfection, probed with anti-myc antibody. (E and F) Representative flank xenografts (bar = 10 mm in E Upper), Western blot of myc-tagged REN (stained with antimyc antibody, E Lower), average volumes and mitotic rates (± SD) (F). Mitotic figures were counted in 20 randomly selected ×600 high-powered microscopic fields (HPFs) containing the same number of cells in tumors produced by pWPT-REN and pWPT-GFP lentivirus-transduced D283 cells in athymic nude mice. *, P < 0.01 vs. GFP, by Mann–Whitney test. (G) Hematoxylin/eosin-stained sections show the reduced cellularity of REN tumor mass with abundant stromal component separating cell clusters (GIV and GV), compared with the compact cell mass of GFP tumors (GI) invading muscle tissue (arrows, GII). (Magnification, ×20 and ×10.) Electron microscopy of REN tumors showing apoptotic (arrowhead) and vacuolated (arrows) cells (GVI) compared with GFP xenografts (GIII). (Magnification, ×2,950.)
Fig. 3.
REN is an antagonist of the Hedgehog pathway. (A and B) Cells were cotransfected with pCMVHA-Gli1 (32) or WT REN-expressing vectors alone (A and B) or in combinations (Gli1/REN ratios, 1:0.125 to 1:1) (A), or mutant (ΔPOZ, ΔC) (B) or empty vectors (A and B), together with the 3′Gli-BS-luc reporter. Luciferase activity is normalized to the 100% maximum activity driven by the inducer. (C) REN inhibits the activation of Gli-RE-luc (containing 12 repeated Gli consensus sequences in a TK minimal promoter vector) and Ptc-luc reporters (19) induced by Gli1 or Gli2 (pCDNAHIS-hGli2) (18) in D283 cells, whereas it does not effect the unrelated MMTV-luc promoter [pGL3-MMTV, containing the MMTV LTR, activated by cotransfected pSG5AR androgen receptor vector and 10-7 M dihydrotestosterone (DHT) treatment]. Gli3 vector (18) is inactive on GliRE-luc. (D) REN suppresses the Gli1-induced activation of endogenous Ptch1, IGF2, and cyclinD2 target genes. RNA from HEK293 cells 24 h after transfection with the indicated plasmids was analyzed by RT-Q-PCR (fold increase with respect to empty vector-transfected cells).
Fig. 4.
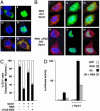
REN regulates the nuclear and cytoplasmic localization of Gli1. (A) Daoy cells were transfected with GFP-tagged Gli1 alone [AI; blue indicates 4′,6-diamidino-2-phenylindole (DAPI) nuclear staining] or in combination with hemagglutinin (HA)-tagged Dyrk1 (32) (AII, AIII, and AIV; blue) or REN (AVI; red) encoding vectors and analyzed by immunofluorescence microscopy by using mouse anti-HA. Transfection with REN alone is represented in AV.(B) REN antagonizes Dyrk1-induced Gli1 nuclear transfer. Immunofluorescence staining of Daoy cells cotransfected with GFP-tagged Gli1 (green) and HA-tagged Dyrk1 (blue) in combination with myc-REN or with myc-ΔPOZ-REN (red) encoding vectors. Merging of REN/Dyrk (BI and BIV), Gli/Dyrk (BII and BV) and Gli/REN/Dyrk (BIII and BVI) indicates colocalization of Gli1 and REN (yellow). (C) Percentages (mean ± SD of six experiments) of cells showing Gli1 cytoplasmic staining (filled box) or nuclear alone (open box) localization after transfection with the indicated plasmids. At least 150 cells were scored for each coverslip. (D) REN antagonizes the transcriptional activity of Gli1 on 3′Gli-BS-luciferase reporter enhanced by cotransfected Dyrk1 in Daoy cells.
Fig. 5.
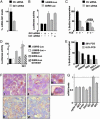
REN inhibits MB growth by negatively regulating Gli1. (A) D283 cells were transfected with either control siRNA (no. 1022079, Qiagen, Valencia, CA) or Gli1 siRNA (no. 1022368, Qiagen) by using RNAi Fect agent (Qiagen), as suggested by the manufacturer. _siRNA_-transfected cells were assayed for Gli1 mRNA levels by RT-Q-PCR 72 h after transfection. (B) Then 0.5 μgof either Gli-RE-luc reporter or the same control reporter vector devoid of Gli consensus sequence (ΔGli-RE-luc) was transfected into D283 cells alone or with control siRNA or Gli1 siRNA, and luciferase activity was measured after 72 h. (C) BrdUrd-incorporating cells (mean ± SD from three experiments) performed 72 h after transfection with control siRNA or Gli1 siRNA alone or in combination with REN vector in the presence of 20% (+) or 0.2% (-) FCS. (D) Gli-RE-luc or ΔGli-RE-luc were transfected into D283 cells along with empty vector or Gli1 or dominant negative Gli1N407 (N407) (mean ± SD from three experiments). (E) BrdUrd incorporating cells (mean ± SD from three experiments) 24 h after transfection with GFP, REN, or Gli1N407 as indicated. (F) Immunohistochemistry of D283 cell xenografts shows mostly nuclear staining of Gli1 in GFP-infected tumors (FI and FIII) and a reduced Gli1 staining mostly localized in the cytoplasm in REN-infected tumors (FII and FIV). A decreased cytoplasmic staining of Ptch1 was also observed in REN-infected (FVI) compared with GFP-infected xenografts (FV). (G) RT-Q-PCR of mRNA expression of the indicated genes in REN tumor xenografts compared with GFP-infected tumors assigned the value 1. Results are expressed in arbitrary units as relative quantification normalized with endogenous control (β-actin and GAPDH).
Similar articles
- Chromosome 17p deletion in human medulloblastoma: a missing checkpoint in the Hedgehog pathway.
De Smaele E, Di Marcotullio L, Ferretti E, Screpanti I, Alesse E, Gulino A. De Smaele E, et al. Cell Cycle. 2004 Oct;3(10):1263-6. doi: 10.4161/cc.3.10.1200. Epub 2004 Oct 3. Cell Cycle. 2004. PMID: 15467454 Review. - Histone deacetylase and Cullin3-REN(KCTD11) ubiquitin ligase interplay regulates Hedgehog signalling through Gli acetylation.
Canettieri G, Di Marcotullio L, Greco A, Coni S, Antonucci L, Infante P, Pietrosanti L, De Smaele E, Ferretti E, Miele E, Pelloni M, De Simone G, Pedone EM, Gallinari P, Giorgi A, Steinkühler C, Vitagliano L, Pedone C, Schinin ME, Screpanti I, Gulino A. Canettieri G, et al. Nat Cell Biol. 2010 Feb;12(2):132-42. doi: 10.1038/ncb2013. Epub 2010 Jan 17. Nat Cell Biol. 2010. PMID: 20081843 - Identification and characterization of KCASH2 and KCASH3, 2 novel Cullin3 adaptors suppressing histone deacetylase and Hedgehog activity in medulloblastoma.
De Smaele E, Di Marcotullio L, Moretti M, Pelloni M, Occhione MA, Infante P, Cucchi D, Greco A, Pietrosanti L, Todorovic J, Coni S, Canettieri G, Ferretti E, Bei R, Maroder M, Screpanti I, Gulino A. De Smaele E, et al. Neoplasia. 2011 Apr;13(4):374-85. doi: 10.1593/neo.101630. Neoplasia. 2011. PMID: 21472142 Free PMC article. - Hedgehog checkpoints in medulloblastoma: the chromosome 17p deletion paradigm.
Ferretti E, De Smaele E, Di Marcotullio L, Screpanti I, Gulino A. Ferretti E, et al. Trends Mol Med. 2005 Dec;11(12):537-45. doi: 10.1016/j.molmed.2005.10.005. Epub 2005 Nov 14. Trends Mol Med. 2005. PMID: 16290230 Review. - Medulloblastoma: a problem of developmental biology.
Rubin JB, Rowitch DH. Rubin JB, et al. Cancer Cell. 2002 Jul;2(1):7-8. doi: 10.1016/s1535-6108(02)00090-9. Cancer Cell. 2002. PMID: 12150819
Cited by
- Pentameric assembly of potassium channel tetramerization domain-containing protein 5.
Dementieva IS, Tereshko V, McCrossan ZA, Solomaha E, Araki D, Xu C, Grigorieff N, Goldstein SA. Dementieva IS, et al. J Mol Biol. 2009 Mar 20;387(1):175-91. doi: 10.1016/j.jmb.2009.01.030. Epub 2009 Jan 23. J Mol Biol. 2009. PMID: 19361449 Free PMC article. - Cerebellum development and medulloblastoma.
Roussel MF, Hatten ME. Roussel MF, et al. Curr Top Dev Biol. 2011;94:235-82. doi: 10.1016/B978-0-12-380916-2.00008-5. Curr Top Dev Biol. 2011. PMID: 21295689 Free PMC article. Review. - Bax deficiency prolongs cerebellar neurogenesis, accelerates medulloblastoma formation and paradoxically increases both malignancy and differentiation.
Garcia I, Crowther AJ, Gama V, Miller CR, Deshmukh M, Gershon TR. Garcia I, et al. Oncogene. 2013 May 2;32(18):2304-14. doi: 10.1038/onc.2012.248. Epub 2012 Jun 18. Oncogene. 2013. PMID: 22710714 Free PMC article. - Intellectual disability, oncogenes and tumour suppressor genes: the way forward?
Bidart M, Coutton C. Bidart M, et al. J Genet. 2012 Aug;91(2):257-8. doi: 10.1007/s12041-012-0154-6. J Genet. 2012. PMID: 22942102 No abstract available. - Expression of Gli1 and PARP1 in medulloblastoma: an immunohistochemical study of 65 cases.
Pizem J, Popovic M, Cör A. Pizem J, et al. J Neurooncol. 2011 Jul;103(3):459-67. doi: 10.1007/s11060-010-0431-2. Epub 2010 Oct 16. J Neurooncol. 2011. PMID: 20953661
References
- Wechsler-Reya, R. & Scott, M. P. (2001) Annu. Rev. Neurosci. 24, 385-428. - PubMed
- Rubin, J. B. & Rowitch, D. H. (2002) Cancer Cell 2, 7-8. - PubMed
- Ellison, D. (2002) Neuropathol. Appl. Neurobiol. 28, 257-282. - PubMed
- Ruiz i Altaba, A., Sanchez, P. & Dahmane, N. (2002) Nat. Rev. Cancer 2, 361-382. - PubMed
Publication types
MeSH terms
Substances
LinkOut - more resources
Full Text Sources
Other Literature Sources
Molecular Biology Databases


