Activation of the phosphoinositide 3-kinase-Akt-mammalian target of rapamycin signaling pathway is required for metabotropic glutamate receptor-dependent long-term depression - PubMed (original) (raw)
Activation of the phosphoinositide 3-kinase-Akt-mammalian target of rapamycin signaling pathway is required for metabotropic glutamate receptor-dependent long-term depression
Lingfei Hou et al. J Neurosci. 2004.
Abstract
Hippocampal long-term depression (LTD) is a long-lasting decrease in synaptic strength that is most commonly studied at glutamatergic inputs to pyramidal cells in hippocampal area CA1. Activation of G-protein-coupled group I (including types 1 and 5) metabotropic glutamate receptors (mGluRs) by the pharmacological agonist (RS)-3,5-dihydroxyphenylglycine (DHPG) elicits LTD in area CA1 of the hippocampus. Recent reports have shown that de novo protein synthesis is necessary for DHPG-induced LTD. However, relatively little is known about the signaling pathways that couple mGluRs to translation initiation. In this study, we investigated whether the activation of the phosphoinositide 3-kinase (PI3K)-Akt-mammalian target of rapamycin (mTOR) pathway, which has been shown to regulate translation initiation, is necessary for mGluR-LTD induced by DHPG. We found that brief incubations of mouse hippocampal slices with DHPG resulted in increased phosphorylation of Akt and mTOR in hippocampal area CA1. Two structurally unrelated PI3K inhibitors, LY294002 and wortmannin, blocked the DHPG-induced increases in phosphorylation of Akt and mTOR. Biochemical fractionation studies showed that the DHPG-induced increase in the phosphorylation of Akt and mTOR could be detected in synaptoneurosome preparations, and immunohistochemical analysis revealed that similar increases could be detected in both stratum pyramidale and stratum radiatum in area CA1. Finally, we observed that both PI3K inhibitors and rapamycin, an mTOR inhibitor, prevented mGluR-LTD induced by DHPG. Together, our findings indicate that activation of the PI3K-Akt-mTOR signaling cascade is required for mGluR-LTD and suggest that this pathway may couple group I mGluRs to translation initiation in hippocampal area CA1.
Figures
Figure 1.
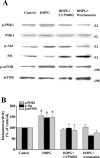
DHPG induces increases in the phosphorylation of PDK1, Akt, and mTOR in hippocampal area CA1. Hippocampal slices were treated with DHPG (50 μ
m
) for 5 min. Slices then were incubated with ACSF in the absence of DHPG for the indicated times, and the level of phosphorylation in PDK1, Akt, and mTOR was assessed via Western blot analysis. A, Representative Western blots for phoshorylated PDK1 (p-PDK1), total PDK1, phosphorylated Akt (p-Akt), and total Akt. Numbers indicate molecular weight markers. Con, Control. B, p-PDK1 and p-Akt immunoreactivity were normalized to total PDK1 and total Akt immunoreactivity. Values are means ± SEM. p-PDK1 values: 0 min, 154 ± 20% of control, n = 6; 5 min, 210 ± 57% of control, n = 4; 10 min, 161 ± 18% of control, n = 4; 20 min, 120 ± 11% of control, n = 4. p-Akt values: 0 min, 146 ± 19% of control, n = 13; 5 min, 199 ± 52% of control, n = 4; 10 min, 152 ± 28% of control, n = 4; 20 min, 90 ± 8% of control, n = 4. C, Representative Western blots for phosphorylated mTOR (p-mTOR) and total mTOR. Numbers indicate molecular weight markers. D, p-mTOR immunoreactivity was normalized to total mTOR immunoreactivity. Values are means ± SEM. p-mTOR values: 0 min, 149 ± 19% of control, n = 10; 5 min, 92 ± 25% of control, n = 4; 10 min, 108 ± 22% of control, n = 4; 20 min, 104 ± 36% of control, n = 4. * denotes statistical significance compared with control with a Student's t test (p < 0.05).
Figure 2.
DHPG-induced increases in the phosphorylation of PDK1, Akt, and mTOR are PI3K dependent. Hippocampal slices were preincubated with either normal ACSF, LY294002 (50 μ
m
), or wortmannin (100 n
m
) for 30 min and then exposed to DHPG (50 μ
m
) for 5 min in the presence of either normal ACSF or the inhibitors. A, Representative Western blots for phosphorylated PDK1 (p-PDK1), total PDK1, phosphorylated Akt (p-Akt), total Akt, phosphorylated mTOR (p-mTOR), and total mTOR. B, Phosphorylated kinase immunoreactivity was normalized to total kinase immunoreactivity for each kinase. Values are means ± SEM. p-PDK1 values: DHPG, 154 ± 20% of control, n = 6; DHPG plus LY294002, 91 ± 6% of control, n = 3; DHPG plus wortmannin, 103 ± 11% of control, n = 3. p-Akt values: DHPG, 146 ± 19% of control, n = 13; DHPG plus LY294002, 98 ± 18% of control, n = 6; DHPG plus wortmannin, 57 ± 8% of control, n = 6. p-mTOR values: DHPG, 149 ± 20% of control, n = 10; DHPG plus LY294002, 88 ± 27% of control, n = 6; DHPG plus wortmannin, 76 ± 13% of control, n = 6. * denotes statistical significance compared with control with a Student's t test (p < 0.05).
Figure 3.
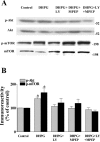
The effects of mGluR1 and mGluR5 antagonists on DHPG-induced increases in Akt and mTOR phosphorylation. Hippocampal slices were preincubated with either normal ACSF, LY367385 (LY; 100 μ
m
), a selective mGluR1 antagonist, MPEP (10 μ
m
), a selective mGluR5 antagonist, or LY367385 plus MPEP for 30 min and then exposed to DHPG (50 μ
m
) for 5 min in the presence of either normal ACSF or the antagonists. A, Representative Western blots for phosphorylated Akt (p-Akt), total Akt, phosphorylated mTOR (p-mTOR), and total mTOR. B, Phosphorylated kinase immunoreactivity was normalized to total kinase immunoreactivity for each kinase. Values are means ± SEM. p-Akt values: DHPG, 137 ± 10% of control, n = 12; DHPG plus LY367385, 105 ± 5% of control, n = 9; DHPG plus MPEP, 99 ± 6% of control, n = 9; DHPG plus LY367385 plus MPEP, 93 ± 7% of control. p-mTOR values: DHPG, 164 ± 19% of control, n = 13; DHPG plus LY367385, 121 ± 19% of control, n = 12; DHPG plus MPEP, 119 ± 17% of control, n = 12; DHPG plus LY367385 plus MPEP, 85 ± 6% of control. * denotes statistical significance compared with control with a Student's t test (p < 0.05).
Figure 4.
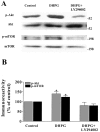
DHPG-induced increases in the phosphorylation of Akt and mTOR in hippocampal synaptoneurosomes are PI3K dependent. Hippocampal slices were preincubated with either normal ACSF or LY294002 (50 μ
m
) for 30 min and then exposed to DHPG (50 μ
m
) for 5 min in the presence of either normal ACSF or the inhibitor. After the exposure to DHPG, the slices were frozen, and synaptoneurosomes were prepared as described in Materials and Methods. A, Representative Western blots for phosphorylated Akt (p-Akt), total Akt, phosphorylated mTOR (p-mTOR), and total mTOR. B, Phosphorylated kinase immunoreactivity was normalized to total kinase immunoreactivity for each kinase. Values are means ± SEM. p-Akt values: DHPG, 140 ± 11% of control, n = 3; DHPG plus LY294002, 81 ± 17% of control, n = 3. p-mTOR values: DHPG, 123 ± 6% of control, n = 3; DHPG plus LY294002, 80 ± 9% of control, n = 3. * denotes statistical significance compared with control with a Student's t test (p < 0.05).
Figure 5.
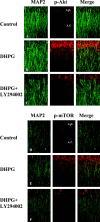
DHPG-induced increases in the phosphorylation of Akt and mTOR are present in both soma and dendrites of pyramidal cells in hippocampal area CA1. Representative confocal images were obtained from slices that were double labeled using antibodies specific for phospho-Akt, phospho-mTOR, and the dendritic marker MAP2. Phosphorylated Akt (p-Akt) and phosphorylated mTOR (p-mTOR) labeling is indicated by red, MAP2 labeling is indicated by green, and dual labeling is indicated by yellow. A, D, Sham-treated slices. B, E, Slices treated with 50 μ
m
DHPG for 5 min. C, F, Slices that were preincubated with 50 μ
m
LY294002 for 30 min and then incubated with 50 μ
m
DHPG for 5 min in the presence of the inhibitor. Stratum pyramidale (s.p.) and stratum radiatum (s.r.) are indicated. Images were obtained with a 20× objective (numerical aperture, 0.75) at zoom 2.0.
Figure 6.
DHPG-induced mGluR-LTD is dependent on PI3K in hippocampal area CA1. A-F, mGluR-LTD was induced by incubation of slices with DHPG (50 μ
m
) for 5 min in the presence of either vehicle, LY294002 (A, B), wortmannin (C, D), or LY303511 (E, F). Either the vehicle or the inhibitors were present in the perfusing solution 20 min before and during the treatment with DHPG, as indicated by the bars by each panel. A, Plotted are ensemble averages for the initial slope of the fEPSP for 30 min before, during, and 50 min after treatment of DHPG in the presence of either vehicle or LY294002 (50 μ
m
). LTD was significantly inhibited by LY294002 as determined by a Student's t test (p < 0.01) at the final time point (vehicle: closed squares; fEPSP slope, 76 ± 4% of baseline; n = 8; LY294002: open squares; fEPSP slope, 98 ± 4% of baseline; n = 7). B, Representative fEPSPs before and 50 min after treatment with DHPG in the presence of either vehicle or LY294002. C, Plotted are ensemble averages for the initial slope of the fEPSP for 30 min before, during, and 50 min after treatment of DHPG in the presence of either vehicle or wortmannin (100 n
m
). LTD was significantly inhibited by wortmannin as determined by a Student's t test (p < 0.05) at the final time point (vehicle: closed squares; fEPSP slope, 76 ± 2% of baseline; n = 8; wortmannin: open squares; fEPSP slope, 90 ± 6% of baseline; n = 8). D, Representative fEPSPs before and 50 min after treatment with DHPG in the presence of either vehicle or wortmannin. E, Plotted are ensemble averages for the initial slope of the fEPSP for 30 min before, during, and 50 min after treatment of DHPG in the presence of either vehicle or LY303511 (50 μ
m
). LY303511 had no effect on LTD at the 50 min time point (vehicle: closed squares; fEPSP slope, 75 ± 5% of baseline; n = 8; LY303511: open squares; fEPSP slope, 68 ± 10% of baseline; n = 5; p > 0.05 with a Student's t test). F, Representative fEPSPs before and 50 min after treatment with DHPG in the presence of either vehicle or LY303511. Calibration: (B, D, F) 5 mV, 2 msec.
Figure 7.
DHPG-induced mGluR-LTD is dependent on mTOR in hippocampal area CA1. _A_-D, mGluR-LTD was induced by incubation of slices with DHPG (50 μ
m
) for 5 min in the presence of either vehicle, rapamycin (A, B), or ascomycin (C, D). Either vehicle or the inhibitors were present in the perfusing solution 10 min before, during, and 10 min after the treatment with DHPG, as indicated by the bars in each panel. A, Plotted are ensemble averages for the initial slope of the fEPSP for 20 min before, during, and 50 min after treatment of DHPG in the presence of either vehicle or rapamycin (20 n
m
). LTD was significantly inhibited by rapamycin as determined with a Student's t test (p < 0.0001) at the final time point (vehicle: closed squares; fEPSP slope, 76 ± 3% of baseline; n = 12; rapamycin: open squares; fEPSP slope, 92 ± 1% of baseline; n = 8). B, Representative fEPSPs before and 50 min after treatment with DHPG in the presence of either vehicle or rapamycin. C, Plotted are ensemble averages for the initial slope of the fEPSP for 20 min before, during, and 50 min after treatment of DHPG in the presence of either vehicle or ascomycin (20 n
m
). Ascomycin had no effect on LTD at the 50 min time point (vehicle: closed squares; fEPSP slope, 75 ± 4% of baseline; n = 8; ascomycin: open squares; fEPSP slope, 79 ± 6% of baseline; n = 4; p > 0.05 with a Student's t test). F, Representative fEPSPs before and 50 min after treatment with DHPG in the presence of either vehicle or ascomycin. Calibration: (B, D) 5 mV, 2 msec.
Figure 8.
The role of mGluR1 and mGluR5 in DHPG-induced LTD in mouse hippocampal area CA1. _A_-F, mGluR-LTD was induced by incubation of slices with DHPG (50 μ
m
) for 5 min in the presence of either vehicle, MPEP (A, B), LY367385 (C, D), or LY367385 plus MPEP (E, F). Either vehicle or the antagonists were present in the perfusing solution 20 min before and during the treatment with DHPG, as indicated by the bars in each panel. A, Plotted are ensemble averages for the initial slope of the fEPSP for 30 min before, during, and 50 min after treatment of DHPG in the presence of either vehicle or MPEP (10 μ
m
). LTD was significantly inhibited by MPEP as determined with a Student's t test (p < 0.01) at the final time point (vehicle: closed squares; fEPSP slope, 74 ± 2% of baseline; n = 14; MPEP: open squares; fEPSP slope, 89 ± 3% of baseline; n = 8). B, Representative fEPSPs before and 50 min after treatment with DHPG in the presence of either vehicle or MPEP. C, Plotted are ensemble averages for the initial slope of the fEPSP for 30 min before, during, and 50 min after treatment of DHPG in the presence of either vehicle or LY367385 (100 μ
m
). LTD was not significantly inhibited by LY367385 as determined with a Student's t test (p > 0.05) at the final time point (vehicle: closed squares; fEPSP slope, 76 ± 4% of baseline; n = 8; wortmannin: open squares; fEPSP slope, 79 ± 11% of baseline; n = 14). D, Representative fEPSPs before and 50 min after treatment with DHPG in the presence of either vehicle or LY367385. E, Plotted are ensemble averages for the initial slope of the fEPSP for 30 min before, during, and 50 min after treatment of DHPG in the presence of either vehicle or LY367385 plus MPEP. LTD was significantly inhibited by LY367385 plus MPEP as determined with a Student's t test (p < 0.001) at the final time point (vehicle: closed squares; fEPSP slope, 74 ± 2% of baseline; n = 14; LY367385 plus MPEP: open squares; fEPSP slope, 98 ± 2% of baseline; n = 5). F, Representative fEPSPs before and 50 min after treatment with DHPG in the presence of either vehicle or LY367385 plus MPEP. Calibration: (B, D, F) 5 mV, 2 msec.
Similar articles
- The inhibition of glycogen synthase kinase 3beta by a metabotropic glutamate receptor 5 mediated pathway confers neuroprotection to Abeta peptides.
Liu F, Gong X, Zhang G, Marquis K, Reinhart P, Andree TH. Liu F, et al. J Neurochem. 2005 Dec;95(5):1363-72. doi: 10.1111/j.1471-4159.2005.03474.x. Epub 2005 Nov 8. J Neurochem. 2005. PMID: 16277616 - Caveolin-1 knockout mice exhibit impaired induction of mGluR-dependent long-term depression at CA3-CA1 synapses.
Takayasu Y, Takeuchi K, Kumari R, Bennett MV, Zukin RS, Francesconi A. Takayasu Y, et al. Proc Natl Acad Sci U S A. 2010 Dec 14;107(50):21778-83. doi: 10.1073/pnas.1015553107. Epub 2010 Nov 23. Proc Natl Acad Sci U S A. 2010. PMID: 21098662 Free PMC article. - Extracellular signal-regulated protein kinase activation is required for metabotropic glutamate receptor-dependent long-term depression in hippocampal area CA1.
Gallagher SM, Daly CA, Bear MF, Huber KM. Gallagher SM, et al. J Neurosci. 2004 May 19;24(20):4859-64. doi: 10.1523/JNEUROSCI.5407-03.2004. J Neurosci. 2004. PMID: 15152046 Free PMC article. - Metabotropic glutamate receptor-mediated long-term depression: molecular mechanisms.
Gladding CM, Fitzjohn SM, Molnár E. Gladding CM, et al. Pharmacol Rev. 2009 Dec;61(4):395-412. doi: 10.1124/pr.109.001735. Epub 2009 Nov 19. Pharmacol Rev. 2009. PMID: 19926678 Free PMC article. Review. - (S)-3,5-DHPG: a review.
Wiśniewski K, Car H. Wiśniewski K, et al. CNS Drug Rev. 2002 Spring;8(1):101-16. doi: 10.1111/j.1527-3458.2002.tb00218.x. CNS Drug Rev. 2002. PMID: 12070529 Free PMC article. Review.
Cited by
- The mTOR inhibitor rapamycin has limited acute anticonvulsant effects in mice.
Hartman AL, Santos P, Dolce A, Hardwick JM. Hartman AL, et al. PLoS One. 2012;7(9):e45156. doi: 10.1371/journal.pone.0045156. Epub 2012 Sep 12. PLoS One. 2012. PMID: 22984623 Free PMC article. - Interaction between Ephrins and mGlu5 metabotropic glutamate receptors in the induction of long-term synaptic depression in the hippocampus.
Piccinin S, Cinque C, Calò L, Molinaro G, Battaglia G, Maggi L, Nicoletti F, Melchiorri D, Eusebi F, Massey PV, Bashir ZI. Piccinin S, et al. J Neurosci. 2010 Feb 24;30(8):2835-43. doi: 10.1523/JNEUROSCI.4834-09.2010. J Neurosci. 2010. PMID: 20181581 Free PMC article. - Hodgkin Lymphoma Cell Lines and Tissues Express mGluR5: A Potential Link to Ophelia Syndrome and Paraneoplastic Neurological Disease.
Schnell S, Knierim E, Bittigau P, Kreye J, Hauptmann K, Hundsdoerfer P, Morales-Gonzalez S, Schuelke M, Nikolaus M. Schnell S, et al. Cells. 2023 Feb 13;12(4):606. doi: 10.3390/cells12040606. Cells. 2023. PMID: 36831273 Free PMC article. - Spatially restricting gene expression by local translation at synapses.
Wang DO, Martin KC, Zukin RS. Wang DO, et al. Trends Neurosci. 2010 Apr;33(4):173-82. doi: 10.1016/j.tins.2010.01.005. Epub 2010 Mar 19. Trends Neurosci. 2010. PMID: 20303187 Free PMC article. Review. - Saikosaponin D exerts antidepressant effect by regulating Homer1-mGluR5 and mTOR signaling in a rat model of chronic unpredictable mild stress.
Liu CY, Chen JB, Liu YY, Zhou XM, Zhang M, Jiang YM, Ma QY, Xue Z, Zhao ZY, Li XJ, Chen JX. Liu CY, et al. Chin Med. 2022 May 24;17(1):60. doi: 10.1186/s13020-022-00621-8. Chin Med. 2022. PMID: 35610650 Free PMC article.
References
- Anwyl R (1999) Metabotropic glutamate receptors: electrophysiological properties and role in plasticity. Brain Res Brain Res Rev 29: 83-120. - PubMed
- Beaumont V, Zhong N, Fletcher R, Froemke RC, Zucker RS (2001) Phosphorylation and local presynaptic protein synthesis in calcium- and calcineurin-dependent induction of crayfish long-term facilitation. Neuron 32: 489-501. - PubMed
- Bolshakov VY, Siegelbaum SA (1994) Postsynaptic induction and presynaptic expression of hippocampal long-term depression. Science 264: 1148-1152. - PubMed
Publication types
MeSH terms
Substances
LinkOut - more resources
Full Text Sources
Other Literature Sources
Miscellaneous


