Ribosomal protein L24 defect in belly spot and tail (Bst), a mouse Minute - PubMed (original) (raw)
Ribosomal protein L24 defect in belly spot and tail (Bst), a mouse Minute
Edward R Oliver et al. Development. 2004 Aug.
Abstract
Ribosomal protein mutations, termed Minutes, have been instrumental in studying the coordination of cell and tissue growth in Drosophila. Although abundant in flies, equivalent defects in mammals are relatively unknown. Belly spot and tail (Bst) is a semidominant mouse mutation that disrupts pigmentation, somitogenesis and retinal cell fate determination. Here, we identify Bst as a deletion within the Rpl24 riboprotein gene. Bst significantly impairs Rpl24 splicing and ribosome biogenesis. Bst/+ cells have decreased rates of protein synthesis and proliferation, and are outcompeted by wild-type cells in C57BLKS<-->ROSA26 chimeras. Bacterial artificial chromosome (BAC) and cDNA transgenes correct the mutant phenotypes. Our findings establish Bst as a mouse Minute and provide the first detailed characterization of a mammalian ribosomal protein mutation.
Figures
Fig. 1
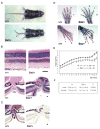
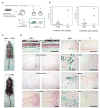
C57BLKS Bst/+ phenotypes. (A) Kinked tail (arrowhead), white hind feet and belly spot. (B) Hematoxylin and eosin staining of +/+ and Bst/+ retinal sections. (C) Neurofilament (NF160) immunostaining of adjacent sections at the optic nerve head, marking ganglion and horizontal cells. (D) Skeletal stain of newborn fore limbs (upper) and hind limbs (lower), showing preaxial polydactyly (0) and triphalangy of the first digit (1) in Bst/+ limbs. (E) Postnatal growth curves of littermate +/+ and Bst/+ pups. (F) Weights (grams±s.e.m.) of adult +/+ and Bst/+ littermates, compared using a two-tailed unpaired _t_-test (_n_=44 total). Scale bars in B,C: 50 μm. ON, optic nerve head; ONL, outer nuclear layer; INL, inner nuclear layer; GCL, ganglion cell layer.
Fig. 2
Positional cloning of Bst. (A) Recombination data localizing Bst to a 0.5 cM interval on mouse chromosome 16 (shaded in red) and excluding Opa1 and Hes1. Bst and microsatellite alleles transmitted by F1 parents are indicated together with the number of N2 progeny in each class. The 135 N2 mice typed with the extended marker set (left) are included in the total (right). □, CAST/Ei; ■, C57BLKS. (B) Physical map of critical Bst region derived from Ensembl mouse genome database (3.35 Mb, v. 4.1.1). The map shows informative microsatellite markers, candidate transcription units and relevant BAC clones (blue). The nonrecombinant interval maps within cytogenetic band B4, spans 1.5 Mb (green arrows) and includes Rpl24 (red).
Fig. 3
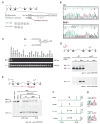
The Bst mutation. (A) Map of the Rpl24 gene showing the informative PCR, the 4 bp deletion within the intron 1 branchpoint, the first codons of the open reading frame, and the premature stop codon in Bst (red). (B) Sequence chromatograms comparing +/+ and Bst/+ PCR products. The exon 2 splice acceptor (arrowheads) and 4 bp Bst deletion (boxed) are indicated. (C) Allele-specific PCR assay used to distinguish Bst and wild-type Rpl24 alleles. The deletion is unique to the C57BLKS Bst/+ strain. (D) Bst causes abnormal Rpl24 splicing with retention of intron 1. RT-PCR was performed using the indicated primers. A common downstream primer (*) was end-labeled with 32P using T4 DNA kinase. Product A originates from correctly spliced Rpl24 transcripts, whereas A′ and B indicate inclusion of intron 1. The relatively low abundance of product A′ is due to PCR competition and nonsense-mediated decay. The low level of product B in the wild-type lanes most probably reflects amplification from hnRNA. (E) Some Bst transcripts are correctly spliced. RT-PCR was performed using (Bst/+ × SPRET) F1 RNA and the indicated primers. The upstream primer spans the exon 1–2 junction. Product C (388 bp) was end-labeled and digested with _Alu_I to distinguish between musculus (M, 365 bp) and spretus (S, 135 bp) alleles. The molar ratio of M and S products is 1.27 for +/+ mice and 0.26 for Bst/+ littermates, giving a normalized expression level for Bst of 0.21 (±0.02). (F) Similar fluorometric assay performed using a HEX-labeled reverse primer and ABI sequencer following _Alu_I digestion. The Bst expression level is 0.25 (±0.03) relative to wild-type musculus Rpl24. (G) Sequence of correctly spliced Rpl24 cDNAs amplified from F1 mice, showing the informative _Alu_I site in exon 4 (overlined, sense strand). The normalized ratio of Bst to wild-type peak areas is 0.22 (±0.01).
Fig. 4
Transgene correction of the Bst phenotype. (A) BAC clone RP23-10L10 (blue) contains Rpl24 and five other genes, and spans 181 kb (Ensembl mouse genome database, v. 12.3.1). (B) Founder Tg321 carries an intact RP23-10L10 transgene, which suppresses external Bst phenotypes in all doubly heterozygous offspring (compare mice 4514 and 4516 with 4515). Genotypes were determined using BAC end (red) and allele-specific Rpl24 PCRs. (C) Correction data summary. Four BAC transgenic founders were mated to C57BLKS Bst/+ mice. Tg321 and Tg326, which are intact, correct Bst phenotypes but Tg898 or Tg901, which lack Rpl24, do not. (D) Human RPL24 transgene (R26-huL24). The cDNA is ubiquitously expressed using the murine ROSA26 promoter.
Fig. 5
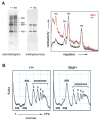
Bst impairs ribosome biogenesis. (A) Bst/+ causes a decrease in processed rRNAs. C57BLKS Bst/+ and +/+ littermates were fasted for 48 hours and re-fed for 2 hours. Tissue RNAs were radiolabeled by an intraperitoneal 32P injection at the start of the re-feeding period. (left) Autoradiogram of pulse-labeled liver RNA (5 μg/lane). Mature 18S and 28S rRNAs and 34S and 45S precursors are indicated. (center) Methylene Blue stain of the same filter, showing total RNA. (right) Density tracing of autoradiogram showing that Bst has a greater effect on 28S rRNA. The Bst/+ profile is scaled twofold to equalize 18S rRNA levels. The relative peak areas measured for 45S, 34S, 28S and 18S rRNAs are 0.9, 1.1, 5.9 and 4.2 (+/+) and 0.9, 1.1, 1.5 and 1.8 (Bst/+), respectively. (B) Sucrose gradients of liver homogenates from normally fed +/+ and Bst/+ adult littermates. UV absorbance peaks corresponding to ribosomal subunits and polysomes are labeled. A prominent shoulder is present between the 60S and 80S subunits (arrowhead).
Fig. 6
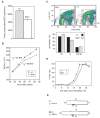
Cellular effects of the Bst mutation. (A) Protein synthesis ([3H]leu incorporation) is decreased in Bst/+ MEFs (P<0.001, two-tailed unpaired _t_-test). (B) Growth rates of subconfluent +/+ and Bst/+ MEF cultures (cell counts), showing decreased doubling time of Bst/+ cells (P<0.001, two-tailed unpaired _t_-test). (C) Bivariate cell cycle analysis. Cells were sorted by total DNA content (7-AAD fluorescence) and BrdU incorporation (FITC-conjugated antibody). Density plots represent combined data from two experiments (20,000 cells each). The histogram shows the proportion of cells in G1, S and G2/M sectors (red boxes); bars indicate the range for two experiments. The distribution of cells in G1, S and G2/M differ significantly between Bst/+ and +/+ (P<0.001, χ2=233 for 2×3 contingency table). (D) S-phase entry of Bst/+ MEFs is delayed following 48 hour serum starvation. [3H]thymidine incorporation was normalized for each genotype to the highest level measured during the experiment. The panel shows one of three independent experiments performed. Each point shows the average of three cultures; bars indicate standard deviation. (E) Model for increased cell cycle length, based on bivariate FACS analysis and doubling times. Assuming the length of S phase is constant, Bst/+ MEFs remain significantly longer in G1 before reaching the restriction point (R).
Fig. 7
Bst causes a growth disadvantage in vivo. (A) Chimera analysis protocol. Exactly five or ten R26 ES cells were injected into mutant and control blastocysts. (B) Coat color comparison of adult chimeras. Rpl24 genotypes were determined by allele-specific PCR. C57BLKS and R26 contributions were determined by the percent black (a/a) and agouti (A/A) coloration, respectively. The R26 contribution was significantly greater in chimeras derived from Bst/+ blastocysts, in experiments where five (left) or ten (right) ES cells were injected (P<0.01, Mann-Whitney nonparametric rank sum tests). Open and closed symbols represent female and male chimeras, respectively. (C) Typical Bst/+ and +/+ chimeras showing 50% and 5% agouti coats, respectively (ten ES cell injection). (D) β-Galactosidase staining of cryopreserved tissues from chimeras in (C). The increased R26 contribution (lacZ positive) in Bst/+ chimeras is evident in all tissues examined. Scale bars: 150 μm.
Similar articles
- Rpl24Bst mutation suppresses colorectal cancer by promoting eEF2 phosphorylation via eEF2K.
Knight JR, Vlahov N, Gay DM, Ridgway RA, Faller WJ, Proud C, Mallucci GR, von der Haar T, Smales CM, Willis AE, Sansom OJ. Knight JR, et al. Elife. 2021 Dec 13;10:e69729. doi: 10.7554/eLife.69729. Elife. 2021. PMID: 34895463 Free PMC article. - The p53 tumor suppressor causes congenital malformations in Rpl24-deficient mice and promotes their survival.
Barkić M, Crnomarković S, Grabusić K, Bogetić I, Panić L, Tamarut S, Cokarić M, Jerić I, Vidak S, Volarević S. Barkić M, et al. Mol Cell Biol. 2009 May;29(10):2489-504. doi: 10.1128/MCB.01588-08. Epub 2009 Mar 9. Mol Cell Biol. 2009. PMID: 19273598 Free PMC article. - Phenotypic and functional characterization of Bst+/- mouse retina.
Riazifar H, Sun G, Wang X, Rupp A, Vemaraju S, Ross-Cisneros FN, Lang RA, Sadun AA, Hattar S, Guan MX, Huang T. Riazifar H, et al. Dis Model Mech. 2015 Aug 1;8(8):969-76. doi: 10.1242/dmm.018176. Epub 2015 May 8. Dis Model Mech. 2015. PMID: 26035379 Free PMC article. - Probing the mechanisms underlying human diseases in making ribosomes.
Farley KI, Baserga SJ. Farley KI, et al. Biochem Soc Trans. 2016 Aug 15;44(4):1035-44. doi: 10.1042/BST20160064. Biochem Soc Trans. 2016. PMID: 27528749 Free PMC article. Review. - Guarding the 'translation apparatus': defective ribosome biogenesis and the p53 signaling pathway.
Chakraborty A, Uechi T, Kenmochi N. Chakraborty A, et al. Wiley Interdiscip Rev RNA. 2011 Jul-Aug;2(4):507-22. doi: 10.1002/wrna.73. Epub 2011 Jan 20. Wiley Interdiscip Rev RNA. 2011. PMID: 21957040 Review.
Cited by
- Reducing the aneuploid cell burden - cell competition and the ribosome connection.
Baker NE, Montagna C. Baker NE, et al. Dis Model Mech. 2022 Nov 1;15(11):dmm049673. doi: 10.1242/dmm.049673. Epub 2022 Nov 29. Dis Model Mech. 2022. PMID: 36444717 Free PMC article. Review. - Ribosomal protein L24 mediates mammalian microRNA processing in an evolutionarily conserved manner.
Tzur Y, Dubnov S, Madrer N, Bar A, Nadorp B, Mishra N, Heppenstall P, Bennett ER, Greenberg DS, Winek K, Soreq H. Tzur Y, et al. Cell Mol Life Sci. 2024 Jan 23;81(1):55. doi: 10.1007/s00018-023-05088-w. Cell Mol Life Sci. 2024. PMID: 38261097 Free PMC article. - Calmodulin inhibitors improve erythropoiesis in Diamond-Blackfan anemia.
Taylor AM, Macari ER, Chan IT, Blair MC, Doulatov S, Vo LT, Raiser DM, Siva K, Basak A, Pirouz M, Shah AN, McGrath K, Humphries JM, Stillman E, Alter BP, Calo E, Gregory RI, Sankaran VG, Flygare J, Ebert BL, Zhou Y, Daley GQ, Zon LI. Taylor AM, et al. Sci Transl Med. 2020 Oct 21;12(566):eabb5831. doi: 10.1126/scitranslmed.abb5831. Sci Transl Med. 2020. PMID: 33087503 Free PMC article. - The other lives of ribosomal proteins.
Bhavsar RB, Makley LN, Tsonis PA. Bhavsar RB, et al. Hum Genomics. 2010 Jun;4(5):327-44. doi: 10.1186/1479-7364-4-5-327. Hum Genomics. 2010. PMID: 20650820 Free PMC article. Review. - Prostaglandin E2 and its receptor EP2 trigger signaling that contributes to YAP-mediated cell competition.
Ishihara E, Nagaoka Y, Okuno T, Kofuji S, Ishigami-Yuasa M, Kagechika H, Kamimura K, Terai S, Yokomizo T, Sugimoto Y, Fujita Y, Suzuki A, Nishina H. Ishihara E, et al. Genes Cells. 2020 Mar;25(3):197-214. doi: 10.1111/gtc.12750. Epub 2020 Feb 7. Genes Cells. 2020. PMID: 31989743 Free PMC article.
References
- Abrams JM. Competition and compensation: coupled to death in development and cancer. Cell. 2002;110:403–406. - PubMed
- Alexiades MR, Cepko C. Quantitative analysis of proliferation and cell cycle length during development of the rat retina. Dev Dyn. 1996;205:293–307. - PubMed
- Altshuler DM, Turner DL, Cepko CL. Specification of cell type in the vertebrate retina. In: Lam DMK, Shatz CJ, editors. Cell Lineage and Cell Fate in Visual System Development. Cambridge, MA: MIT Press; 1991. pp. 37–58.
Publication types
MeSH terms
Substances
Grants and funding
- EY12994/EY/NEI NIH HHS/United States
- R01 EY014259-03/EY/NEI NIH HHS/United States
- GM067840/GM/NIGMS NIH HHS/United States
- EY14259/EY/NEI NIH HHS/United States
- HD07505/HD/NICHD NIH HHS/United States
- R01 EY012994/EY/NEI NIH HHS/United States
- T32 HD007505/HD/NICHD NIH HHS/United States
- R01 GM067840/GM/NIGMS NIH HHS/United States
- T32 GM007863/GM/NIGMS NIH HHS/United States
- P60 DK020572/DK/NIDDK NIH HHS/United States
- T32 GM07863/GM/NIGMS NIH HHS/United States
- DK20572/DK/NIDDK NIH HHS/United States
- R01 GM067840-04/GM/NIGMS NIH HHS/United States
- P30 DK020572/DK/NIDDK NIH HHS/United States
- R01 EY014259/EY/NEI NIH HHS/United States
- R01 EY011729-05/EY/NEI NIH HHS/United States
LinkOut - more resources
Full Text Sources
Molecular Biology Databases
