Segmental phylogenetic relationships of inbred mouse strains revealed by fine-scale analysis of sequence variation across 4.6 mb of mouse genome - PubMed (original) (raw)
Segmental phylogenetic relationships of inbred mouse strains revealed by fine-scale analysis of sequence variation across 4.6 mb of mouse genome
Kelly A Frazer et al. Genome Res. 2004 Aug.
Abstract
High-density SNP screening of panels of inbred mouse strains has been proposed as a method to accelerate the identification of genes associated with complex biomedical phenotypes. To evaluate the potential of these studies, a more detailed understanding of the fine structure of sequence variation across inbred mouse strains is needed. Here, we use high-density oligonucleotide arrays to discover an extremely dense set of SNPs in 13 classical and two wild-derived inbred strains in five genomic intervals totaling 4.6 Mb of DNA sequence, and then analyze the segmental haplotype structure defined by these high-density SNPs. This analysis reveals segments ranging from 12 to 608 kb in length within which the inbred strains have a simple and distinct phylogenetic relationship with typically two or three clades accounting for the 13 classical strains examined. The phylogenetic relationships among strains change abruptly and unpredictably from segment to segment, and are distinct in each of the five genomic regions examined. The data suggest that at least 12 strains would need to be resequenced for exhaustive SNP discovery in every region of the mouse genome, that approximately 97% of the variation among inbred strains is ancestral (between clades) and approximately 3% private (within clades), and provides critical insights into the proposed use of panels of inbred strains to identify genes underlying quantitative trait loci.
Copyright 2004 Cold Spring Harbor Laboratory Press ISSN
Figures
Figure 1
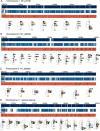
Phylogenetic relationships of the 13 inbred classical strains and the two wild-derived strains. (A_–_E) For each of the five sequence contigs, the phylogenetic relationships within adjacent segments are shown. (Top and middle panels) The locations of unique sequences represented on the high-density arrays and identified SNPs, respectively. (Third panel) The segmental block locations (numbered), the boundaries of which were determined by analyzing transition points between high SNP and low SNP blocks for all 78 pairwise sequence comparisons of the 13 inbred classical strains. The phylogenetic relationships of the 15 inbred mouse strains (color-coded squares), determined using the Kimura 2-parameter model, are shown for each segment. For the wild-derived inbred strains, CAST/EiJ and SPRET/EiJ, uneven amounts of missing data may affect the relative branch lengths of these outgroups in some trees as a result of unbalanced loss of CAST or SPRET specific polymorphisms. (F) For the five sequence contigs, classical inbred strains that were in the same phylogenetic group for every segment in the contig are shown together. Missing SNP data are ignored for this analysis. Related strains are depicted as solid and hatched squares of the same color (A/J and A/HeJ, BALB/cByJ and BALB/cJ, C57BL/6J and B10.D2-H2d, NZB/B1NJ and NZW/LacJ).
Figure 2
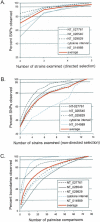
The number of strains required to capture >95% of the observed variation was calculated both by determining how many of the 13 inbred classical strains were needed to detect >95% of the SNPs (A,B) and by determining how many of the 78 pairwise comparisons of the inbred classical strains were needed to observe >95% of the segmental block boundaries (C). (A,B) The percent of SNPs observed versus the number of inbred classical strains examined was determined for each contig individually as well as the average across all five contigs. (A) Directed selection of strains based on their level of divergence (based on the Kimura 2-parameter distance), starting with the most divergent. (B) The selection of inbred strains was random (nondirected selection), with the process being repeated 100 times, and the average results for each contig and across all five contigs shown. (C) The percent of segmental boundaries observed versus the number of inbred classical pairwise comparisons examined is shown for each contig individually as well as the average across all five contigs. Intervals containing relatively few segmental blocks, such as NT_014989, require fewer pairs of strains, and intervals containing an above-average number of segmental blocks, such as NT_026540, require more pairs of strains.
Similar articles
- A high-resolution multistrain haplotype analysis of laboratory mouse genome reveals three distinctive genetic variation patterns.
Zhang J, Hunter KW, Gandolph M, Rowe WL, Finney RP, Kelley JM, Edmonson M, Buetow KH. Zhang J, et al. Genome Res. 2005 Feb;15(2):241-9. doi: 10.1101/gr.2901705. Genome Res. 2005. PMID: 15687287 Free PMC article. - The mosaic structure of variation in the laboratory mouse genome.
Wade CM, Kulbokas EJ 3rd, Kirby AW, Zody MC, Mullikin JC, Lander ES, Lindblad-Toh K, Daly MJ. Wade CM, et al. Nature. 2002 Dec 5;420(6915):574-8. doi: 10.1038/nature01252. Nature. 2002. PMID: 12466852 - Large-scale discovery and genotyping of single-nucleotide polymorphisms in the mouse.
Lindblad-Toh K, Winchester E, Daly MJ, Wang DG, Hirschhorn JN, Laviolette JP, Ardlie K, Reich DE, Robinson E, Sklar P, Shah N, Thomas D, Fan JB, Gingeras T, Warrington J, Patil N, Hudson TJ, Lander ES. Lindblad-Toh K, et al. Nat Genet. 2000 Apr;24(4):381-6. doi: 10.1038/74215. Nat Genet. 2000. PMID: 10742102 - [Advances in high-density whole genome-wide single nucleotide polymorphism array in cancer research].
Zeng ZY, Xiong W, Zhou YH, Li XL, Li GY. Zeng ZY, et al. Ai Zheng. 2006 Nov;25(11):1454-8. Ai Zheng. 2006. PMID: 17094921 Review. Chinese. - Haplotype association mapping in mice.
Tsaih SW, Korstanje R. Tsaih SW, et al. Methods Mol Biol. 2009;573:213-22. doi: 10.1007/978-1-60761-247-6_12. Methods Mol Biol. 2009. PMID: 19763930 Review.
Cited by
- Comparisons of substitution, insertion and deletion probes for resequencing and mutational analysis using oligonucleotide microarrays.
Karaman MW, Groshen S, Lee CC, Pike BL, Hacia JG. Karaman MW, et al. Nucleic Acids Res. 2005 Feb 18;33(3):e33. doi: 10.1093/nar/gni034. Nucleic Acids Res. 2005. PMID: 15722479 Free PMC article. - Ancestral bias in the Hras1 gene and distal Chromosome 7 among inbred mice.
Drew JC, Kastenmeier AS, Drinkwater NR. Drew JC, et al. Mamm Genome. 2007 Oct;18(10):732-8. doi: 10.1007/s00335-007-9061-1. Epub 2007 Sep 29. Mamm Genome. 2007. PMID: 17906893 Free PMC article. - Utilization of a whole genome SNP panel for efficient genetic mapping in the mouse.
Moran JL, Bolton AD, Tran PV, Brown A, Dwyer ND, Manning DK, Bjork BC, Li C, Montgomery K, Siepka SM, Vitaterna MH, Takahashi JS, Wiltshire T, Kwiatkowski DJ, Kucherlapati R, Beier DR. Moran JL, et al. Genome Res. 2006 Mar;16(3):436-40. doi: 10.1101/gr.4563306. Epub 2006 Feb 3. Genome Res. 2006. PMID: 16461637 Free PMC article. - Discovery of a new HBB haplotype w2 in a wild-derived house mouse, Mus musculus.
Sato JJ, Shinohara A, Miyashita N, Koshimoto C, Tsuchiya K, Nakahara I, Morita T, Yonekawa H, Moriwaki K, Yamaguchi Y. Sato JJ, et al. Mamm Genome. 2008 Mar;19(3):155-62. doi: 10.1007/s00335-008-9094-0. Epub 2008 Feb 26. Mamm Genome. 2008. PMID: 18299925 - An imputed genotype resource for the laboratory mouse.
Szatkiewicz JP, Beane GL, Ding Y, Hutchins L, Pardo-Manuel de Villena F, Churchill GA. Szatkiewicz JP, et al. Mamm Genome. 2008 Mar;19(3):199-208. doi: 10.1007/s00335-008-9098-9. Epub 2008 Feb 27. Mamm Genome. 2008. PMID: 18301946 Free PMC article.
References
- Beck, J.A., Lloyd, S., Hafezparast, M., Lennon-Pierce, M., Eppig, J.T., Festing, M.F., and Fisher, E.M. 2000. Genealogies of mouse inbred strains. Nat. Genet. 24: 23–25. - PubMed
- Bonhomme, F., Guenet, J.-L., Dod, B., Moriwaki, K., and Bulfield, G. 1987. The polyphyletic origin of laboratory inbred mice and their rate of evolution. J. Linn. Soc. 30: 51–58.
- Chee, M., Yang, R., Hubbell, E., Berno, A., Huang, X.C., Stern, D., Winkler, J., Lockhart, D.J., Morris, M.S., and Fodor, S.P. 1996. Accessing genetic information with high-density DNA arrays. Science 274: 610–614. - PubMed
- Felsenstein, J. 1989. PHYLIP—Phylogeny Inference Package (Version 3.2). Cladistics 5: 164–166.
WEB SITE REFERENCES
- http://ftp.genome.washington.edu/RM/RepeatMasker.html; RepeatMasker.
MeSH terms
LinkOut - more resources
Full Text Sources
Other Literature Sources
Molecular Biology Databases
Miscellaneous

