Structure of the conserved core of the yeast Dot1p, a nucleosomal histone H3 lysine 79 methyltransferase - PubMed (original) (raw)
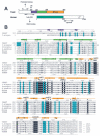
Fig. 1. Conserved Dot1-core region
A, schematic representation of Dot1 homologues from yeast and human. A proteolytic cleavage site of the yeast Dot1 is labeled V8. B, sequence alignment of the conserved Dot1 core region. The alignment includes members of the Dot1 family from various species: S. cerevisiae (NP_010728), C. elegans (NM_058569), Drosophila (AE003675), A. gambiae (EAA03558), mouse (BB678539), and human (NP_115871). The residue number and secondary structural elements of yeast Dot1 (helices A-M and strands 1–11) are shown above the aligned sequences. Dashed lines indicate disordered regions. The amino acids highlighted are invariant (white letter against black background) and conserved (black against gray) among six members of the Dot1 family. The letters above the sequences indicate the structural/functional roles of the corresponding yeast Dot1 residues: h indicates intramolecular hydrophobic interaction, i indicates intramolecular nonhydrophobic (polar or charge) interaction, s indicates surface-exposed invariant residues potentially important for substrate binding, t indicates structural residue Gly involved in the sharp turn, asterisk indicates cofactor-interacting residue, K indicates residues forming the target Lys binding pocket, and R indicates residues potentially involved in binding an Arg (most likely from the substrate). The conserved sequence motifs characteristic of class I MTases are labeled with roman numbers according to Ref. .
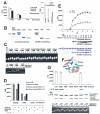
Fig. 2. Activity of yeast Dot1p
A, enzymatic activity of purified Dot1p proteins, measured as trichloroacetic acid-precipitable counts. The enzymes used were all purified recombinant proteins. The substrate nucleosomes were either purified from chicken erythrocyte (left panel) or recombinant nucleosome (right panel). Protein-arginine MTase (PRMT1), used as positive control, was active on both recombinant nucleosomes and histones. B, fluorographic results of an AdoMet cross-linking experiment at pH 8.5 (right panel) are shown with results of Coomassie staining to control for the amount of deletion mutant proteins tested (left panel). C, binding of mononucleosome (from chicken erythrocyte, top panel) and DNA (36-base pair, bottom panel) by yeast Dot1p, two deletion mutants (Δ157 and Δ172), and Δ157 point mutants (E422D or A, W543F or A, and Y550F or A) were analyzed by gel shift assays at three different protein:nucleosome or protein:DNA ratios. D, Dot1p methyl transfer activity is stimulated by preincubation of a 150-base pair DNA with enzyme. Top panel, trichloroacetic acid-precipitable counts. Bottom panel, autoradiograph (the enzyme:DNA ratio of 1:5). E, HKMT activities of Dot1p and deletion mutant Δ157 as a function of pH (top panel) and AdoMet cross-linking as a function of pH (bottom panel). F, Tyr550 adopts a different rotamer conformation as Tyr312 in human Dot1L. G, biochemical properties of Δ157 point mutations: top, HKMT activity using mononucleosome substrate; middle, AdoMet binding analyzed by cross-linking experiments showing Coomassie stain and fluorography; bottom, DNA binding analyzed by gel shift assay at three protein:DNA ratios. All mutant proteins were expressed at levels similar to that of the Δ157 wild-type.
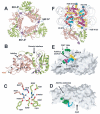
Fig. 3. Structure of yeast Dot1p
A, a trimer of Δ157 formed in the crystallographic asymmetric unit. The trimer interface is formed between the N-terminal helix α_A (which is unique to yeast Dot1p and C. elegans homologue, see Fig. 1_B) and the outer surface of the AdoHcy-binding site of a neighboring non-crystallographic related molecule. We also note that yeast Hst2, a member of Sir2 family of NAD+-dependent protein deacetylases, forms a functional homotrimer mediated by the N-terminal extension to the central catalytic core domain (62), which is characteristic of the other Sir2 homologues. On the other hand, helix α_A may be involved in regulation of Dot1p via protein-protein interactions. B, monomer structure of Δ157. The N-terminal clamp is shown in purple, the N-terminal helical domain in green, and the C-terminal catalytic domain in orange. The bound AdoHcy is shown as a stick model. C, the polar interface between the N- and C-terminal domains. D, a GRASP (63) representation showing the cleft between the two domains and a surface hole, through which the adenine ring of AdoHcy is visible. E, a GRASP representation, 90° rotated from the view in panel D, showing the conserved motifs (X, IV, and VIII) surrounding the active site pocket, through which the AdoHcy sulfur atom is visible. Conserved motifs I, II, and III are buried and invisible from the surface. In addition, there are three surface-exposed invariant residues, Tyr364 and Phe367 in the loop after helix α_G, and Lys508 after strand β_9 (Fig. 1_B). The surface locations of Tyr364 and Phe367, approximate to the motif X that provides residues in the active site formation (Val371 and Gly373, Fig. 4_B), the Arg-binding site (Tyr372 and Glu374, Fig. 4_C), and the lid to the AdoHcy binding site (Fig. 5, C and E), suggests these two conserved residues may have implications in specific enzyme-substrate interactions. Lys508, located right next to Phe481 of motif IV, might also contribute to substrate binding and/or catalysis. F, a model of Dot1p docked with a nucleosome. The structure of the nucleosome core particle is shown as ribbons (red, H3; green, H4; magenta, H2A; yellow, H2B; gray lines, DNA). The model was put together by aligning the target Lys79 of histone H3, located on the nucleosome disk surface, with the active site pocket of Dot1p. By rotating the Dot1p along the Lys79 active site alignment, the N-terminal residues, either disordered (residues 158–175) or not included in the crystallization (residues 1–157), could be in a position to contact DNA directly and/or involved in interaction with monoubiquitin covalently attached to histone H2B Lys123. In the model shown, no conformational changes are required to dock. However, major conformational changes of either the nucleosome and/or the enzyme would be needed to allow the side chain of Lys79 of H3 moving additional a few angstroms into the active site pocket.
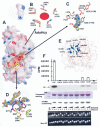
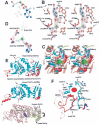
Fig. 4. Putative substrate binding cleft
A, the surface charge distribution is displayed as blue for positive, red for negative, and white for neutral. The bound AdoHcy sulfur atom can be seen through the active site pocket. B, five hydrophobic residues form the active site pocket (the corresponding residue from human Dot1L is in parentheses). The opening of the pocket is ∼4 × 5 Å, where the target Lys could be inserted. C, a difference electron density map (contoured at 1.5_σ_) indicates that an Arg residue can be fit into a surface-binding pocket formed partly by invariant residues of motif X (Glu374 and Tyr372) and Tyr350 of helix α_F. D, a difference electron density (contoured at 1.2_σ) can be fit by a stretch of peptide, possibly from the C terminus of a crystallographically related molecule. The identity of the side chain cannot be determined unambiguously, except a Lys residue bound in a surface pocket with interaction to Asp301. The main chain atoms of the Lys residue form _β_-strand like interactions with the N-terminal residue Thr178. E, the basic nucleosomal disk surface around Lys79 (green) of histone H3 contains many positively charged residues (blue). F, biochemical properties of Δ157 point mutations in the Arg and Lys binding pockets: top, HKMT activity using mononucleosome (from chicken erythrocyte) as substrates; middle, AdoMet binding analyzed by cross-linking experiments showing Coomassie stain and fluorography; bottom, DNA binding and mononucleosome binding analyzed by gel shift assay at three protein:DNA or protein:nucleosome ratios. All mutant proteins were expressed at levels similar to that of the Δ157 wild-type.
Fig. 5. AdoHcy binding site and active site
A, superimposition of AdoHcy conformations in yeast Dot1p and SET domain HKMT DIM-5 (19). B, stereo view of the AdoHcy binding site. The difference electron density map is contoured at 2.5_σ. Dashed lines_ indicate hydrogen bonds. The letter w indicates bound water molecules. Interactions involving main chain (mc) atoms are indicated in parentheses. C, stereo view of active site. The AdoHcy is in van der Waals surface model, colored with red for oxygen atoms, blue for nitrogen atoms, white for carbon atoms, and green for the sulfur (placed where the transferable methyl group would be attached in AdoMet). D, superimposition of yeast Dot1p (AdoHcy and Asn479) and protein glutamine MTase HemK (48) (AdoMet, Asn197, and free glutamine). E, structural comparison of yeast Dot1p (residues 176–567; top panel) and human Dot1L (residues 5–332; middle panel). Besides deletion or insertion (located in N and C termini), the largest conformational differences, indicated by arrows, between the two catalytic domains, are the hairpin loop between strands _β_10 and β_11 (containing motif VIII) and the lid for the entrance to the cofactor binding (containing motif X). Superposition of yeast Dot1p and human Dot1L (bottom panel), indicating a hinge movement between two domains, possibly caused by the binding of the Arg (see Fig. 4_C). F, superimposition of the hairpin loop conformations in yeast Dot1p and human Dot1L (in parentheses).
