A morphological correlate of synaptic scaling in visual cortex - PubMed (original) (raw)
A morphological correlate of synaptic scaling in visual cortex
Wes Wallace et al. J Neurosci. 2004.
Abstract
We studied the response of dendritic spines in the thalamic-recipient zone of rat visual cortex to simple manipulations of the visual environment. We measured the morphologies of a total of 3824 spines located on the basal dendrites of 60 layer 3 pyramidal cells. As expected from previous studies, we found a significantly lower spine density in dark-reared animals at postnatal day 30 (P30) compared with light-reared controls. Additional analysis revealed that the spines in dark-reared animals were significantly shorter and more bulbous than in light-reared animals. When these two results were combined, we found that the total synaptic area per unit length of dendrite was conserved, compatible with the phenomenon of "synaptic scaling." We also found that the increase in average spine head diameter is reversed by 10 d of light exposure (starting at P20), but surprisingly, the decrease in spine density is not. Thus, not all effects of dark rearing can be reversed by subsequent visual experience, even when the experience occurs during the third postnatal week.
Figures
Figure 1.
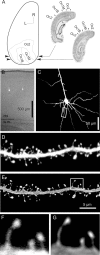
A, Topographical map of the left hemisphere of a rat brain, showing visual areas Oc2 (extrastriate cortex) and Oc1 (striate cortex, with monocular and binocular subfields Oc1M and Oc1B). The range of planes of section we used is indicated by arrowheads, and examples are shown in Nissl sections to the right of the map (redrawn from Zilles, 1985). Scale bar, 2 mm. L, Lateral, R, rostral. B, Transmitted light image of a tissue section overlaid with fluorescence image of two stained neurons. Note the white matter landmarks visible in the bottom part of the image. The cells are in lower layer 2/3 of area Oc1B. C, Maximum intensity projection (MIP) of a confocal image stack, showing a pyramidal neuron typical of those used in our study. The dendritic segment outlined with a rectangle is shown enlarged in D and E. D, E, MIP projections of a confocal image stack showing a single dendritic segment with spines before (D) and after (E) deconvolution. The spines outlined with a box are shown enlarged in F and G. F, G, Examples of spine profiles before (F) and after (G) deconvolution. The pixel resolution is 0.06 × 0.06 μm. In D and E, contrast was individually adjusted for best visibility on the printed page. In F and G, contrast was adjusted in tandem to show the redistribution of pixel intensities after deconvolution.
Figure 2.
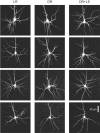
Examples of cell morphologies seen in the three rearing conditions. All images are maximum intensity projections of confocal stacks. Each column shows a set of representative cells taken from one of the three rearing conditions, ranked from most branchy (top) to least branchy (bottom). In the top row of each column is a typical “medium-sized pyramidal cell,” fitting the morphological description of Peters and Kara (1985). The remaining cells in each row resemble the “ovoid pyramidal cell” described by Peters and Kara (1985), with stellate-like dendritic anatomy in the third row, and a more sparse and shapeless dendritic arbor in the fourth row. In all three rearing conditions, the distribution of these dendritic arbor morphologies did not apparently differ.
Figure 3.
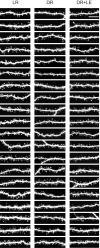
Complete raster of the images used for spine morphology quantification. (An additional 10 images per group were used for spine counts that were not used for spine morphologies.) The images are ranked within each column from least densely spiny to most densely spiny. All images are maximum intensity projections of confocal stacks, shown here as raw images (i.e., before deconvolution). Left, LR; middle, DR; right, DR plus LE. Scale bar, 10 μm.
Figure 4.
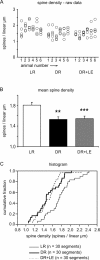
Spine density measurements. A, Raw spine density counts. Each circle represents one dendritic segment; each column represents one animal. B, Mean spine density by condition. The error bars indicate SE. Statistically significant differences from the LR condition are indicated by asterisks (*p < 0.05; **p < 0.01; ***p < 0.001). C, Cumulative probability histogram of spine density by condition.
Figure 5.
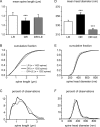
Spine morphology measurements. A, D, Mean spine length and spine head diameter. The error bars indicate SE. Statistically significant differences from the LR condition are indicated by asterisks (*p < 0.05; **p < 0.01; ***p < 0.001). B, E, Cumulative probability histograms of spine morphology measurements by condition. C, F, Traditional histograms of spine morphology measurements, showing non-Gaussian distributions with long upper tails.
Figure 6.
A, B, Spine aspect ratio is perturbed by DR, and this is reversed by LE. C, Total synaptic surface is preserved in DR but reduced after LE. Statistically significant differences from the LR condition are indicated by asterisks (*p < 0.05; **p < 0.01; ***p < 0.001). n = 20 segments per condition. The error bars indicate SE. D, E, Scale drawings showing mean spine density and morphology in the three experimental groups.
Similar articles
- Maternal Loss of Ube3a Impairs Experience-Driven Dendritic Spine Maintenance in the Developing Visual Cortex.
Kim H, Kunz PA, Mooney R, Philpot BD, Smith SL. Kim H, et al. J Neurosci. 2016 Apr 27;36(17):4888-94. doi: 10.1523/JNEUROSCI.4204-15.2016. J Neurosci. 2016. PMID: 27122043 Free PMC article. - Structural dynamics of synapses in vivo correlate with functional changes during experience-dependent plasticity in visual cortex.
Tropea D, Majewska AK, Garcia R, Sur M. Tropea D, et al. J Neurosci. 2010 Aug 18;30(33):11086-95. doi: 10.1523/JNEUROSCI.1661-10.2010. J Neurosci. 2010. PMID: 20720116 Free PMC article. - Effects of light/dark- and dark-rearing on synaptic morphology in the superior colliculus and visual cortex of the postnatal and adult rat.
Bakkum BW, Benevento LA, Cohen RS. Bakkum BW, et al. J Neurosci Res. 1991 Jan;28(1):65-80. doi: 10.1002/jnr.490280107. J Neurosci Res. 1991. PMID: 2041057
Cited by
- Rapid experience-dependent plasticity of synapse function and structure in ferret visual cortex in vivo.
Yu H, Majewska AK, Sur M. Yu H, et al. Proc Natl Acad Sci U S A. 2011 Dec 27;108(52):21235-40. doi: 10.1073/pnas.1108270109. Epub 2011 Dec 12. Proc Natl Acad Sci U S A. 2011. PMID: 22160713 Free PMC article. - Experience-dependent structural plasticity at pre- and postsynaptic sites of layer 2/3 cells in developing visual cortex.
Sun YJ, Espinosa JS, Hoseini MS, Stryker MP. Sun YJ, et al. Proc Natl Acad Sci U S A. 2019 Oct 22;116(43):21812-21820. doi: 10.1073/pnas.1914661116. Epub 2019 Oct 7. Proc Natl Acad Sci U S A. 2019. PMID: 31591211 Free PMC article. - Loss of prestin does not alter the development of auditory cortical dendritic spines.
Bogart LJ, Levy AD, Gladstone M, Allen PD, Zettel M, Ison JR, Luebke AE, Majewska AK. Bogart LJ, et al. Neural Plast. 2011;2011:305621. doi: 10.1155/2011/305621. Epub 2011 May 15. Neural Plast. 2011. PMID: 21773053 Free PMC article. - EphrinB2 and GRIP1 stabilize mushroom spines during denervation-induced homeostatic plasticity.
Bissen D, Kracht MK, Foss F, Hofmann J, Acker-Palmer A. Bissen D, et al. Cell Rep. 2021 Mar 30;34(13):108923. doi: 10.1016/j.celrep.2021.108923. Cell Rep. 2021. PMID: 33789115 Free PMC article.
References
- Ackermann M, Matus A (2003) Activity-induced targeting of profilin and stabilization of dendritic spine morphology. Nat Neurosci 6: 1194-1200. - PubMed
- Bear MF (1996) NMDA-receptor-dependent synaptic plasticity in the visual cortex. Prog Brain Res 108: 205-218. - PubMed
- Braitenberg V, Schuz A (1998) Cortex: statistics and geometry of neuronal connectivity. New York: Springer.
- Buisseret P, Gary-Bobo E, Imbert M (1978) Ocular motility and recovery of orientational properties of visual cortical neurones in dark-reared kittens. Nature 272: 816-817. - PubMed
Publication types
MeSH terms
LinkOut - more resources
Full Text Sources
Research Materials
