Evaluation of the suitability of free-energy minimization using nearest-neighbor energy parameters for RNA secondary structure prediction - PubMed (original) (raw)
Comparative Study
Evaluation of the suitability of free-energy minimization using nearest-neighbor energy parameters for RNA secondary structure prediction
Kishore J Doshi et al. BMC Bioinformatics. 2004.
Abstract
Background: A detailed understanding of an RNA's correct secondary and tertiary structure is crucial to understanding its function and mechanism in the cell. Free energy minimization with energy parameters based on the nearest-neighbor model and comparative analysis are the primary methods for predicting an RNA's secondary structure from its sequence. Version 3.1 of Mfold has been available since 1999. This version contains an expanded sequence dependence of energy parameters and the ability to incorporate coaxial stacking into free energy calculations. We test Mfold 3.1 by performing the largest and most phylogenetically diverse comparison of rRNA and tRNA structures predicted by comparative analysis and Mfold, and we use the results of our tests on 16S and 23S rRNA sequences to assess the improvement between Mfold 2.3 and Mfold 3.1.
Results: The average prediction accuracy for a 16S or 23S rRNA sequence with Mfold 3.1 is 41%, while the prediction accuracies for the majority of 16S and 23S rRNA structures tested are between 20% and 60%, with some having less than 20% prediction accuracy. The average prediction accuracy was 71% for 5S rRNA and 69% for tRNA. The majority of the 5S rRNA and tRNA sequences have prediction accuracies greater than 60%. The prediction accuracy of 16S rRNA base-pairs decreases exponentially as the number of nucleotides intervening between the 5' and 3' halves of the base-pair increases.
Conclusion: Our analysis indicates that the current set of nearest-neighbor energy parameters in conjunction with the Mfold folding algorithm are unable to consistently and reliably predict an RNA's correct secondary structure. For 16S or 23S rRNA structure prediction, Mfold 3.1 offers little improvement over Mfold 2.3. However, the nearest-neighbor energy parameters do work well for shorter RNA sequences such as tRNA or 5S rRNA, or for larger rRNAs when the contact distance between the base-pairs is less than 100 nucleotides.
Figures
Figure 1
Direct Comparison of Mfold 2.3 and Mfold 3.1 Folding Accuracy for Selected 16S and 23S rRNAs. Base-pairs marked in red are predicted correctly by both Mfold 2.3 and Mfold 3.1. Base-pairs marked in blue are predicted correctly only by Mfold 2.3, and base-pairs marked in green are predicted correctly only by Mfold 3.1. Black base-pairs are not predicted correctly by either version of Mfold. Only canonical base-pairs in the comparative models in the current study and previous Gutell Lab studies are considered. Non-canonical base-pairs in the comparative structure models are not counted. Full-sized versions of each annotated structure diagram are available at our website[36]. A: Archaea 16S rRNA Haloferax volcanii. B.1: Archaea 23S rRNA, 5' half, Thermococcus celer. B.2: Archaea 23S rRNA, 3' half, Thermococcus celer. C: Eukaryotic Nuclear16S rRNA, Giardia intestinalis. D.1: Eukaryotic Nuclear 23S rRNA, 5' half, Giardia intestinalis. D.2: Eukaryotic Nuclear 23S rRNA, 3' half, Giardia intestinalis.
Figure 2
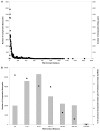
Accuracy of Comparatively Predicted Base-pairs from 496 16S rRNA Sequences and RNA Contact Distance. A. The RNA contact distance (the number of nucleotides in the RNA sequence that are separates the 5' and 3' base-paired) for all 191,994 base-pairs in comparative structure models is determined and plotted. B. The 191,994 comparatively predicted base-pairs are divided into seven RNA contact distance bins (see Logarithmic Binning of Base-pairs by Contact Distance for 16S rRNA in Methods) represented by columns. The accuracies for all base-pairs in each bin are also plotted as points.
Figure 3
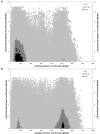
ΔΔG vs. Structural Variation for Pairwise Comparisons from the "Suboptimal Population". A set of 750 structure predictions (optimal + top 749 suboptimal) are compared, resulting in a total of 280,875 pairwise comparisons. The ΔΔG (pre efn2 re-evaluation) for two structure predictions is calculated by taking the absolute value of the difference between the ΔG of each structure prediction before efn2 re-evaluation. Structural variation for two structure predictions is calculated by counting the number of nucleotides in each structure prediction that either 1) have different pairing partners or 2) are paired in one structure prediction and unpaired in the other structure prediction (see Suboptimal Structural Variation Score in Methods). The shading within the figure indicates the number of pairwise comparisons that have the same values for both ΔΔG and structural variation score. A: Archaea 16S rRNA Haloferax volcanii. B: Archaea 16S rRNA Methanospirillum Hungatei.
Figure 4
Frequency of Base-pair predictions within a "Suboptimal Population" for selected 16S rRNAs. The frequency of the prediction of each of the base-pairs in the comparative structure model in a set of 750 structure predictions (optimal + top 749 suboptimal) is displayed on the comparative structure model. Base-pairs marked in red are predicted correctly in all 750 structure predictions. Base-pairs marked in blue are predicted correctly in 600 to 749 structure predictions. Base-pairs marked in magenta are predicted correctly in 151 to 599 structure predictions, base-pairs marked in green are predicted correctly in only 1 to 150 structure predictions, and base-pairs marked in black are not predicted in any of the 750 structure predictions (some are non-canonical or occur in pseudo-knots, and thus are not expected to be predicted correctly). Full-sized versions of each annotated structure diagram are available at our website[36]. A: Archaea 16S rRNA Haloferax volcanii. B: Archaea 16S rRNA Methanospirillum hungatei.
Similar articles
- Correlation of RNA secondary structure statistics with thermodynamic stability and applications to folding.
Wu JC, Gardner DP, Ozer S, Gutell RR, Ren P. Wu JC, et al. J Mol Biol. 2009 Aug 28;391(4):769-83. doi: 10.1016/j.jmb.2009.06.036. Epub 2009 Jun 18. J Mol Biol. 2009. PMID: 19540243 Free PMC article. - Secondary structure and domain architecture of the 23S and 5S rRNAs.
Petrov AS, Bernier CR, Hershkovits E, Xue Y, Waterbury CC, Hsiao C, Stepanov VG, Gaucher EA, Grover MA, Harvey SC, Hud NV, Wartell RM, Fox GE, Williams LD. Petrov AS, et al. Nucleic Acids Res. 2013 Aug;41(15):7522-35. doi: 10.1093/nar/gkt513. Epub 2013 Jun 14. Nucleic Acids Res. 2013. PMID: 23771137 Free PMC article. - Lessons from an evolving rRNA: 16S and 23S rRNA structures from a comparative perspective.
Gutell RR, Larsen N, Woese CR. Gutell RR, et al. Microbiol Rev. 1994 Mar;58(1):10-26. doi: 10.1128/mr.58.1.10-26.1994. Microbiol Rev. 1994. PMID: 8177168 Free PMC article. Review. - Structure and function of ribosomal RNA.
Noller HF, Green R, Heilek G, Hoffarth V, Hüttenhofer A, Joseph S, Lee I, Lieberman K, Mankin A, Merryman C, et al. Noller HF, et al. Biochem Cell Biol. 1995 Nov-Dec;73(11-12):997-1009. doi: 10.1139/o95-107. Biochem Cell Biol. 1995. PMID: 8722015 Review.
Cited by
- Visualizing RNA base-pairing probabilities with RNAbow diagrams.
Aalberts DP, Jannen WK. Aalberts DP, et al. RNA. 2013 Apr;19(4):475-8. doi: 10.1261/rna.033365.112. Epub 2013 Feb 13. RNA. 2013. PMID: 23407410 Free PMC article. - Bridging the gap between in vitro and in vivo RNA folding.
Leamy KA, Assmann SM, Mathews DH, Bevilacqua PC. Leamy KA, et al. Q Rev Biophys. 2016 Jan;49:e10. doi: 10.1017/S003358351600007X. Epub 2016 Jun 24. Q Rev Biophys. 2016. PMID: 27658939 Free PMC article. - Efficient siRNA selection using hybridization thermodynamics.
Lu ZJ, Mathews DH. Lu ZJ, et al. Nucleic Acids Res. 2008 Feb;36(2):640-7. doi: 10.1093/nar/gkm920. Epub 2007 Dec 10. Nucleic Acids Res. 2008. PMID: 18073195 Free PMC article. - Profiling small RNA reveals multimodal substructural signals in a Boltzmann ensemble.
Rogers E, Heitsch CE. Rogers E, et al. Nucleic Acids Res. 2014 Dec 16;42(22):e171. doi: 10.1093/nar/gku959. Epub 2014 Nov 11. Nucleic Acids Res. 2014. PMID: 25392423 Free PMC article. - Comparative and integrative analysis of RNA structural profiling data: current practices and emerging questions.
Choudhary K, Deng F, Aviran S. Choudhary K, et al. Quant Biol. 2017 Mar;5(1):3-24. doi: 10.1007/s40484-017-0093-6. Epub 2017 Mar 30. Quant Biol. 2017. PMID: 28717530 Free PMC article.
References
- Zuker M, Sankoff D. Rna Secondary Structures and Their Prediction. B Math Biol. 1984;46:591–621.
- Zuker M. On finding all suboptimal foldings of an RNA molecule. Science. 1989;244:48–52. - PubMed
- Zuker M. The use of dynamic programming algorithms in RNA secondary structure prediction. In: Waterman MS, editor. Mathematical Methods for DNA Sequences. CRC Press; 1989. pp. 59–184.
- Borer PN, Dengler B, Tinoco I., Jr., Uhlenbeck OC. Stability of ribonucleic acid double-stranded helices. J Mol Biol. 1974;86:843–853. - PubMed
- Tinoco I., Jr., Borer PN, Dengler B, Levin MD, Uhlenbeck OC, Crothers DM, Bralla J. Improved estimation of secondary structure in ribonucleic acids. Nat New Biol. 1973;246:40–41. - PubMed
Publication types
MeSH terms
Substances
LinkOut - more resources
Full Text Sources
Other Literature Sources


