Genetic and biochemical analyses of Pfh1 DNA helicase function in fission yeast - PubMed (original) (raw)
Genetic and biochemical analyses of Pfh1 DNA helicase function in fission yeast
Gi-Hyuck Ryu et al. Nucleic Acids Res. 2004.
Abstract
The Schizosaccharomyces pombe pfh1+ gene (PIF1 homolog) encodes an essential enzyme that has both DNA helicase and ATPase activities and is implicated in lagging strand DNA processing. Mutations in the pfh1+ gene suppress a temperature-sensitive allele of cdc24+, which encodes a protein that functions with Schizosaccharomyces pombe Dna2 in Okazaki fragment processing. In this study, we describe the enzymatic properties of the Pfh1 helicase and the genetic interactions between pfh1 and cdc24, dna2, cdc27 or pol 3, all of which are involved in the Okazaki fragment metabolism. We show that a full-length Pfh1 fusion protein is active as a monomer. The helicase activity of Pfh1 displaced only short (<30 bp) duplex DNA regions efficiently in a highly distributive manner and was markedly stimulated by the presence of a replication-fork-like structure in the substrate. The temperature-sensitive phenotype of a dna2-C2 or a cdc24-M38 mutant was suppressed by pfh1-R20 (a cold-sensitive mutant allele of pfh1) and overexpression of wild-type pfh1+ abolished the ability of the pfh1 mutant alleles to suppress dna2-C2 and cdc24-M38. Purified Pfh1-R20 mutant protein displayed significantly reduced ATPase and helicase activities. These results indicate that the simultaneous loss-of-function mutations of pfh1+ and dna2+ (or cdc24+) are essential to restore the growth defect. Our genetic data indicate that the Pfh1 DNA helicase acts in concert with Cdc24 and Dna2 to process single-stranded DNA flaps generated in vivo by pol -mediated lagging strand displacement DNA synthesis.
Figures
Figure 1
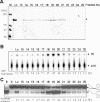
Co-migration of the ATPase and helicase activities with the NusA-Pfh1-F protein. Peak fractions obtained from the first Superdex 200 column were subjected to a second round of Superdex 200 column chromatography. The resulting fractions were analyzed for proteins and enzymatic activities. Fractions analyzed are indicated at the top of each figure. (A) Aliquots (40 μl) of each fraction as indicated were subjected to 8% SDS–PAGE and the gel was stained with Coomassie blue. Lo, load-on of the second round of Superdex 200 column chromatography. M denoted the size (in kDa) of molecular weight marker proteins. The NusA-Pfh1-F protein eluted is as indicated by an arrowhead. (B) The ssDNA-dependent ATPase activity of NusA-Pfh1-F was measured using the standard reaction mixtures as described in Materials and Methods. An aliquot (2 μl) of each fraction was used to measure ATPase activity. The reaction products were analyzed by thin layer chromatography as described in Materials and Methods. The extents of ATP hydrolysis were measured by determining the relative ratios of radioactivities of inorganic 32P-phosphate to uncleaved [γ-32P]ATP and were indicated (as percentage of total ATP) at the bottom of the figure. (C) Helicase activity of NusA-Pfh1-F was measured using the reaction mixtures (20 μl) containing 30 fmol of the indicated DNA substrate as described in Materials and Methods. An aliquot (0.2 μl) of each fraction was used for helicase assays. B denotes boiled substrate. The schematic structure of the substrate used is shown at the right-hand side of the figure. The asterisk in the substrate indicates the position of the 32P-labeled end.
Figure 2
The helicase and ATPase activities are intrinsic to Pfh1. (A) NusA-Pfh1-F (10 μg, 200 μl of the peak fraction obtained from the first Superdex 200 column) was incubated with PBS (−) or 5 U of thrombin (+) at 4°C for 10 h. The input protein and digested products were as indicated. (B) DNA-dependent ATPase activities of PBS-treated (PBS) and thrombin-digested (Thrombin) NusA-Pfh1-F proteins (2 μl, 100 ng each) were measured using reaction conditions described in Materials and Methods. (C) Helicase activities of PBS-treated and thrombin-digested NusA-Pfh1-F proteins [0.2 μl each from (A)] were measured using 15 fmol of the indicated DNA substrate as described in Materials and Methods. The products displaced were analyzed on a 10% polyacrylamide gel. The schematic structures of the DNA substrates used are shown at the right-hand side of the figure. The asterisk in the substrate indicates the position of the 32P-labeled end. B denotes the boiled substrate control. (D) and (E) Aliquots (50 μl, 2.5 μg total) of thrombin-digested NusA-Pfh1-F were mixed with 50 μl containing either 10 μl of either anti-FLAG M2 agarose resin (α-FLAG) or protein G agarose resin (protein G) and the mixtures were incubated at 4°C for 4 h to allow formation of immunocomplexes. Buffer indicates immunodepletion without resin. After the resins were spun down, an aliquot (1 μl, 25 ng) of the supernatant was examined for ATPase (D) or helicase (E) activities. B denotes boiled substrate. For each experiment, the amount of ATP hydrolyzed or substrate unwound are indicated as percentage of input substrate at the bottom of each figure. (F) The schematic structure of the DNA substrate used is shown.
Figure 3
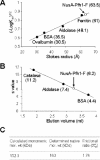
NusA-Pfh1-F is active as a monomer. NusA-Pfh1-F was subjected to gel filtration column chromatography [(A), Superdex 200] and glycerol gradient centrifugation [(B) 15–35% glycerol in 5 ml of buffer T500, 45 000 r.p.m. in a Beckman SW55 rotor]. The size markers used for gel filtration were ferritin (440 kDa, 61 Å), aldolase (158 kDa, 48.1 Å), BSA (66 kDa, 35.5 Å) and ovalbumin (43 kDa, 30.5 Å). The marker proteins used for glycerol gradient were catalase (11.2S), aldolase (7.4S) and BSA (4.4S). The determined Stokes radius and sedimentation values of NusA-Pfh1-F determined were shown in (A) and (B), respectively. (C) By using the sedimentation coefficient and stokes radius, the native molecular weight (163 kDa) and the frictional ratio (f/_f_0, 1.76) of NusA-Pfh1-F are calculated as described by Siegel and Monty (28).
Figure 4
The substrate specificity of Pfh1 helicase. The schematic structures of DNA substrates used are shown at the top of the figure. The asterisks indicate the position of 32P-labels. (A) Pfh1 helicase activity is stimulated by a fork structure in the substrate. The 5′ overhang and Y-structure partial duplex DNA substrates were as indicated. Both substrates contained 30 bp duplex with an identical nucleotide sequence. Increasing levels of NusA-Pfh1-F (0, 0.8, 2.4, 7.2, 22 and 64 fmol) were incubated with 15 fmol of either the 5′ overhang or fork DNA substrate in standard reaction mixtures (see Materials and Methods) at 30°C for 10 min, and the products were analyzed on 10% polyacrylamide gel. B denotes the boiled substrate control. The positions where the substrate and unwound products migrated are as indicated. (B) Pfh1 helicase activity is not dependent on a 5′ free ssDNA end as an entry site. The increasing amounts of NusA-Pfh1-F (0, 1.6, 4.8, 14, 43 and 129 fmol) were incubated with 15 fmol of each DNA substrate in a 20 μl standard reaction mixture at 30°C for 20 min. (C) and (D) Quantification of results obtained in (A) and (B), respectively. The amounts of unwound products (as a percentage of total substrate) were plotted against the amount of enzyme used.
Figure 5
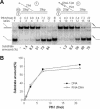
The terminal RNA moiety present in a 5′ flap does not interfere with Pfh1 helicase activity. (A) The two flap-structured substrates are shown at the top of the figure. The circled numbers indicate the oligonucleotides listed in Table 1. The asterisks indicate the position of 32P-labels. Both substrates contained a 5′ flap identical in length and nucleotide sequence except that one consisted of a 12 nt RNA (wavy lines) and a 15 nt DNA segment (thin lines), while the other consisted solely of DNA. Increasing levels (0, 0.3, 0.8, 2.4, 7.2 and 22 fmol) of NusA-Pfh1-F were incubated at 30°C for 5 min with 15 fmol of the indicated substrates in standard reaction mixtures (20 μl) containing 100 mM NaCl, and the products were analyzed on 10% polyacrylamide gel. B denotes boiled substrate control. The migration positions of the substrate and unwound products are as indicated. (B) The amount of each substrate unwound in (A) are plotted against the level of Pfh1 added. Closed and open circles denote results obtained with the substrate containing the DNA only or RNA–DNA chimeric flap, respectively.
Figure 6
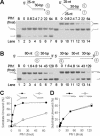
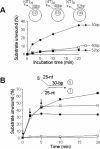
Pfh1 helicase unwinds short duplex DNA in a distributive manner. (A) The oligonucleotides indicated were annealed to ΦX174 sscDNA to construct the 30, 40 or 52 bp partial duplex substrates as shown. The reaction mixtures (200 μl) were pre-incubated at 30°C for 2 min with 150 fmol of each substrate, and the reactions were initiated by the addition of Pfh1 (105 fmol/20 μl reaction). Aliquots (20 μl) were withdrawn at each time points as indicated and the products were analyzed on a 10% polyacrylamide gel. Note that higher levels of Pfh1 were used in this experiment in order to overcome sequestration of Pfh1 by the lengthy ΦX174 ssDNA. (B) Substrate-challenge experiments. Four reaction mixtures (200 μl) containing NusA-Pfh1-F (23 ng, 150 fmol) and the Y-structured DNA substrate (150 fmol) as indicated were assembled on ice and preincubated at 30°C for 3 min in the absence of ATP. ATP (2 mM) was added to each reaction mixture to initiate the unwinding reaction (time 0). Unlabeled substrate DNA (50-fold molar excess, 7.5 pmol/200 μl reaction) was added to each reaction mixture at 0 min (open squares), 2 min (closed circles), 5 min (open squares) after the initiation of reaction (arrows). Aliquots (20 μl) were withdrawn at each time point, and the products were analyzed on a 10% polyacrylamide gel. Closed squares, the amount of substrate unwound in the absence of the competitor DNA.
Figure 7
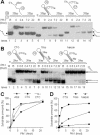
Pfh1 helicase can efficiently displace the hairpin-containing flap strand from DNA substrates. The schematic structures of substrates and oligonucleotides used are shown at the top of each figure. (A) The flap contains either 48 nt random sequence, (CTG)16, or (CTC)16 repeat at the 5′ tail. The asterisks indicate 32P-labeled ends. Increasing levels (0, 2.4, 7.2 and 22 fmol) of NusA-Pfh1-F in a 20 μl reaction mixture (see Materials and Methods) containing 100 mM NaCl were incubated with 15 fmol of each DNA substrate at 30°C for 10 min, and the products were analyzed on 10% polyacrylamide gel. B denotes boiled substrate controls. (B) The flap DNA substrates with a 10 nt or no gap between the hairpin and the junction are shown along with the (CTG)16 flap substrate at the top of the figure. The asterisks indicate 32P-labeled ends. Increasing amounts of Pfh1 (0, 0.8, 2.4, 7.2 and 22 fmol) in a 20 μl reaction mixture containing 100 mM NaCl were incubated at 30°C for 10 min with 15 fmol of each DNA substrate indicated at the top of figure, and the products were analyzed on 10% polyacrylamide gel. B and M denotes boiled substrate controls and size marker for intermediate substrate, respectively. (C) Quantification of the amount of substrate unwound in (A) as a function of Pfh1 added. (D) Quantification of the levels of the two products formed in (B) as a function of Pfh1 added.
Figure 8
Expression of wild-type pfh1+ abolishes the ability of pfh1-R20 or pfh1-R23 to suppress the temperature-sensitive growth defect of cdc24-M38. The cdc24-M38 pfh1-R20 (M38 R20) or the cdc24-M38 pfh1-R23 (M38 R23) double mutant cells (strains 24R20 and 24R23, respectively) were transformed with pREP81x (vector) alone or pREP81x-pfh1 expressing wild-type pfh1+ (Pfh1) as denoted at the left-hand side of figure. Each transformant was grown in liquid media and the cells obtained were spotted in 10-fold dilutions (105, 104, 103, 102 and 101 cells) onto EMM plates or EMM plates containing thiamine (5 μg/ml). The plates were incubated for 3 days at 30°C and at 37°C or 7 days at 18°C as shown.
Figure 9
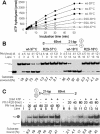
Pfh1-R20 mutant protein is impaired in its enzymatic activities. (A) ATP hydrolysis was measured at varying temperatures. The standard reaction mixtures (200 μl) for ATPase assays were pre-incubated at each temperature for 2 min with 0.2 mM of ATP, and the reaction was initiated by the addition (800 fmol each) of either NusA-Pfh1-F (wt) or NusA-Pfh1-R20-F (R20) mutant enzymes. Aliquots (20 μl) were withdrawn at each time point as indicated, and the amount of ATP hydrolyzed was measured as described in Materials and Methods. (B) Increasing levels (4.5, 13.5, 40.5 and 121 fmol) of either NusA-Pfh1-F (wt) or NusA-Pfh1-R20-F (R20) mutant enzymes were incubated with 15 fmol of DNA substrate (prepared from oligonucleotides 3 and 4) in a 20 μl standard reaction mixtures (see Materials and Methods) at 30°C for 20 min. The amounts of displaced products were analyzed on 10% polyacrylamide gel. B denotes boiled substrate control. (C) Oligonucleotides 3 and 20 were used to construct the 3′-overhang partial duplex DNA substrate. Increasing amounts (20, 40 and 80 fmol) of NusA-Pfh1-F (Pfh1-wt) and mutant NusA-Pfh1-R20-F (Pfh1-R20) were incubated with the substrate (15 fmol) in the presence (+) or absence (−) of 2 mM of ATP at 30°C for 10 min. The reaction products were subjected to electrophoresis for 1 h at 100 V through a 5% polyacrylamide gel in 0.5× TBE. The position of Pfh1–DNA complex is as indicated. The amount of substrate bound is presented at the bottom of the figure.
Figure 10
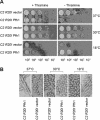
Expression of wild-type pfh1+ abolishes the ability of pfh1-R20 to suppress the temperature-sensitive growth defect of dna2-C2. (A) The dna2-C2 pfh1-R20 (C2 R20) double mutant cells (strain GH102-6) were transformed with pREP81x (vector) alone or pREP81x-pfh1 expressing wild-type pfh1+ (Pfh1) as denoted at the left-hand side of figure. Each transformant was grown in liquid media and the cells obtained were spotted and grown as described in Figure 8. (B) Photographs (×200) of cells obtained from transformation of pREP81x (vector) alone or pREP81x-pfh1 (Pfh1) into the GH102-6 cells.
Similar articles
- The fission yeast pfh1(+) gene encodes an essential 5' to 3' DNA helicase required for the completion of S-phase.
Tanaka H, Ryu GH, Seo YS, Tanaka K, Okayama H, MacNeill SA, Yuasa Y. Tanaka H, et al. Nucleic Acids Res. 2002 Nov 1;30(21):4728-39. doi: 10.1093/nar/gkf590. Nucleic Acids Res. 2002. PMID: 12409464 Free PMC article. - Genetics of lagging strand DNA synthesis and maturation in fission yeast: suppression analysis links the Dna2-Cdc24 complex to DNA polymerase delta.
Tanaka H, Ryu GH, Seo YS, MacNeill SA. Tanaka H, et al. Nucleic Acids Res. 2004 Dec 2;32(21):6367-77. doi: 10.1093/nar/gkh963. Print 2004. Nucleic Acids Res. 2004. PMID: 15576681 Free PMC article. - Genetic analyses of Schizosaccharomyces pombe dna2(+) reveal that dna2 plays an essential role in Okazaki fragment metabolism.
Kang HY, Choi E, Bae SH, Lee KH, Gim BS, Kim HD, Park C, MacNeill SA, Seo YS. Kang HY, et al. Genetics. 2000 Jul;155(3):1055-67. doi: 10.1093/genetics/155.3.1055. Genetics. 2000. PMID: 10880469 Free PMC article. - The functions of the multi-tasking Pfh1Pif1 helicase.
Sabouri N. Sabouri N. Curr Genet. 2017 Aug;63(4):621-626. doi: 10.1007/s00294-016-0675-2. Epub 2017 Jan 4. Curr Genet. 2017. PMID: 28054200 Free PMC article. Review. - Yeast Genome Maintenance by the Multifunctional PIF1 DNA Helicase Family.
Muellner J, Schmidt KH. Muellner J, et al. Genes (Basel). 2020 Feb 20;11(2):224. doi: 10.3390/genes11020224. Genes (Basel). 2020. PMID: 32093266 Free PMC article. Review.
Cited by
- Okazaki fragment metabolism.
Balakrishnan L, Bambara RA. Balakrishnan L, et al. Cold Spring Harb Perspect Biol. 2013 Feb 1;5(2):a010173. doi: 10.1101/cshperspect.a010173. Cold Spring Harb Perspect Biol. 2013. PMID: 23378587 Free PMC article. Review. - WRN helicase unwinds Okazaki fragment-like hybrids in a reaction stimulated by the human DHX9 helicase.
Chakraborty P, Grosse F. Chakraborty P, et al. Nucleic Acids Res. 2010 Aug;38(14):4722-30. doi: 10.1093/nar/gkq240. Epub 2010 Apr 12. Nucleic Acids Res. 2010. PMID: 20385589 Free PMC article. - The Drosophila melanogaster PIF1 Helicase Promotes Survival During Replication Stress and Processive DNA Synthesis During Double-Strand Gap Repair.
Kocak E, Dykstra S, Nemeth A, Coughlin CG, Rodgers K, McVey M. Kocak E, et al. Genetics. 2019 Nov;213(3):835-847. doi: 10.1534/genetics.119.302665. Epub 2019 Sep 19. Genetics. 2019. PMID: 31537623 Free PMC article. - The N-terminal 45-kDa domain of Dna2 endonuclease/helicase targets the enzyme to secondary structure DNA.
Lee CH, Lee M, Kang HJ, Kim DH, Kang YH, Bae SH, Seo YS. Lee CH, et al. J Biol Chem. 2013 Mar 29;288(13):9468-81. doi: 10.1074/jbc.M112.418715. Epub 2013 Jan 22. J Biol Chem. 2013. PMID: 23344960 Free PMC article. - Four pillars of the S-phase checkpoint.
Zou L. Zou L. Genes Dev. 2013 Feb 1;27(3):227-33. doi: 10.1101/gad.213306.113. Genes Dev. 2013. PMID: 23388823 Free PMC article.
References
- Hubscher U. and Seo,Y.S. (2001) Replication of the lagging strand: a concert of at least 23 polypeptides. Mol. Cells, 12, 149–157. - PubMed
- MacNeill S.A. (2001) DNA replication: partners in the Okazaki two-step. Curr. Biol., 11, R842–R844. - PubMed
- Kornberg A. and Baker,T.A. (1992) DNA replication, 2nd edn. W. H. Freeman & Co, NY.
- Bambara R.A., Murante,R.S. and Henricksen,L.A. (1997) Enzymes and reactions at the eukaryotic DNA replication fork. J. Biol. Chem., 272, 4647–4650. - PubMed
- Waga S. and Stillman,B. (1998) The DNA replication fork in eukaryotic cells. Annu. Rev. Biochem., 67, 721–751. - PubMed
Publication types
MeSH terms
Substances
LinkOut - more resources
Full Text Sources
Molecular Biology Databases
Miscellaneous
