Genome-wide mapping of the cohesin complex in the yeast Saccharomyces cerevisiae - PubMed (original) (raw)
Genome-wide mapping of the cohesin complex in the yeast Saccharomyces cerevisiae
Earl F Glynn et al. PLoS Biol. 2004 Sep.
Abstract
In eukaryotic cells, cohesin holds sister chromatids together until they separate into daughter cells during mitosis. We have used chromatin immunoprecipitation coupled with microarray analysis (ChIP chip) to produce a genome-wide description of cohesin binding to meiotic and mitotic chromosomes of Saccharomyces cerevisiae. A computer program, PeakFinder, enables flexible, automated identification and annotation of cohesin binding peaks in ChIP chip data. Cohesin sites are highly conserved in meiosis and mitosis, suggesting that chromosomes share a common underlying structure during different developmental programs. These sites occur with a semiperiodic spacing of 11 kb that correlates with AT content. The number of sites correlates with chromosome size; however, binding to neighboring sites does not appear to be cooperative. We observed a very strong correlation between cohesin sites and regions between convergent transcription units. The apparent incompatibility between transcription and cohesin binding exists in both meiosis and mitosis. Further experiments reveal that transcript elongation into a cohesin-binding site removes cohesin. A negative correlation between cohesin sites and meiotic recombination sites suggests meiotic exchange is sensitive to the chromosome structure provided by cohesin. The genome-wide view of mitotic and meiotic cohesin binding provides an important framework for the exploration of cohesins and cohesion in other genomes.
Conflict of interest statement
The authors have declared that no conflicts of interest exist.
Figures
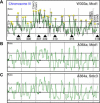
Figure 1. Interactions between Cohesin and CHRIII in S. cerevisiae
The centromere is indicated with a black circle; the smoothed data are indicated with a green line. 50-kb intervals are indicated by vertical grey lines. (A) Data generated from a _cdc16_-arrest ChIP for Mcd1-18Myc in W303a. The midpoint of each feature is used to represent the log2 of the median red:green ratio (left y-axis) with a black line, high firing replication origins are indicated with black triangles, and previously mapped CARC2, CARC1, CARC3, CARC4, CARC5, and CARC6 (Laloraya et al., 2000) correspond to peaks 9, 10, 29, 30, 31, and 32, respectively. Peaks are located and numbered by PeakFinder (with the exception of telomeres) using the parameters described in the Materials and Methods. (B) Smoothed data from _cdc16_-arrest ChIP for Mcd1/Scc1-6HA in A364a. (C) Smoothed data from _cdc16_-arrest ChIP for Smc3-6Myc in A364a.
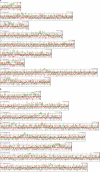
Figure 2. Visual Representation of the Interactions between Mcd1-18Myc and the S. cerevisiae Genome in W303a
For each of the 16 chromosomes the centromere is indicated with a black circle, the smoothed data (based on the log2 of the ratio) is indicated with a green line (left y-axis), and the percent GC is indicated by a red line (right y-axis). Vertical grey bars mark 50-kb intervals. Peaks are located and numbered by PeakFinder (with the exception of telomeres) using the parameters described in the Materials and Methods. For Chromosome XII, peaks 41 and 42 correspond to the previously described peaks CARL1 and CARL2 (Laloraya et al. 2000).
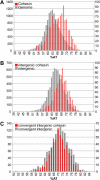
Figure 4. Peaks and AT Content
(A) The AT content for each array element was calculated and put into bins in 1% intervals (grey bars, left y-axis). The AT content for each array element that is a cohesin peak was also put into bins (red bars, right y-axis). (B) The AT content for each intergenic array element was put into bins in 1% intervals (grey bars, left y-axis). The AT content for each intergenic array element that is a cohesin peak was also put into bins (red bars, right y-axis). (C) The AT content for each convergent intergenic array element was put into bins (grey bars, left y-axis) and the AT content for each convergent intergenic array element that is a cohesin peak was also put into bins (red bars, right y-axis).
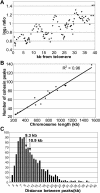
Figure 3. Features of Peaks
(A) Using all cohesin-binding peaks within 40 kb of a telomere ordered based on distance from the telomere, we calculated a five-point moving average for distance in kilobases from the telomere (x-axis) and plotted this as a function of the five-point moving average of the log2 value for the associated peaks (y-axis). (B) Chromosome length (x-axis) is plotted as a function of the number of cohesin peaks (y-axis). A line was fitted using the least squares method and R2 = 0.96. (C) The distance between peaks was put into 1-kb bins; the average distance between peaks is 10.9 kb and the median is 9.3 kb.
Figure 5. Cohesin Sites Mapped Using ChIP Followed by Semiquantitative PCR with Primers at 1-kb Intervals in a YAC Containing Human DNA
(A) Cohesin binding for the entire YAC is shown. (B) Cohesin binding in the region spanning 135–180 kb is shown for the wild-type YAC (black diamonds) and for the YAC containing a replacement of the sequences at 156–162 kb with the gene encoding geneticin resistance (grey squares).
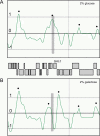
Figure 6. Transcription Affects the Cohesin Peak at the Promoter of GAL2
SGD coordinates 260–320 kb (x-axis) and a gene map are depicted for Chromosome XII. The strain 1827-22D (isogenic to the strain in Figure 1 except CDC16) was grown with either 2% glucose (A) or 2% galactose (B) as the carbon source. Cultures were arrested with nocodazole, and ChIP chip was performed. The smoothed data (as the log2 of the ratio) is depicted in green, the peaks found by PeakFinder are indicated with black dots, and the region corresponding to the GAL2 promoter is indicated with a grey bar. Transcription of GAL2 is up-regulated 42-fold in (B).
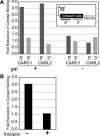
Figure 7. Effect of Transcript Elongation on Cohesin Associated with CARC1 and CARL2 Located on a Plasmid Next to a Galactose-Inducible Promoter
(A) The fold reduction in cohesin binding in the presence (+) or absence (−) of galactose-induced transcription is depicted as a function of the 5′ or 3′ end of the locus. (B) The fold reduction in cohesin binding at CARL2 during galactose-induced transcription in the presence (+) or absence (−) of thiolutin, an inhibitor of transcript elongation.
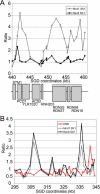
Figure 8. Meiotic Cohesin
DSB data are shown in red, Rec8 data in black, and Mcd1 data in grey. (A) Ratios for meiotic cohesin are compared to mitotic cohesin in SK1 for kilobasepairs 440–461 on Chromosome XII. For the mitotic culture, cells were arrested with nocodazole. For meiotic cells, timepoints were collected every 2 h from hour 4 to hour 12 after transfer to SPM. The median ratio value was used to represent the data. Meiosis is slower in an SK1 strain with an HA-epitope-tagged Rec8 than in a wild-type strain (see Figure 9). The gene structure for this locus is shown below the graph, with genes encoded by the Watson strand labeled on top and genes encoded by the Crick strand labeled on the bottom. (B) Ratios for meiotic cohesin are compared to mitotic cohesin and DSBs for kilobasepairs 295–345 on Chromosome XII.
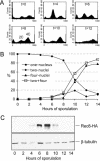
Figure 9. Meiotic Timecourse for an SK1 Strain Containing Rec8-3HA
Cells were collected at the indicated timepoints throughout meiosis using the same experimental regime used to collect the binding sites of Rec8-3HA presented in Figure 8. The epitope tag appears to slow meiosis by 3–4 h as compared to an untagged strain. Three assays were developed to monitor culture synchrony during meiosis. (A) FACS profile of the REC8-3HA strain. Aliquots of cells were fixed with 70% EtOH, followed by FACS analysis. (B) Nuclear division of the REC8-3HA strain. Aliquots of cells were fixed with 1% formaldehyde for 1 h at room temperature. Nuclear DNA was stained by DAPI and visualized under a fluorescence microscope. At least 200 cells were scored at each timepoint. (C) Rec8-3HA protein level. Protein extracts were prepared and subjected to SDS-PAGE and Western blot. The Rec8-3HA protein level was detected by an anti-HA antibody (12CA5). The same blot was stripped and reprobed with anti-β-tubulin antibody to detect the level of β-tubulin, which served as a loading control.
Similar articles
- Transcription alters chromosomal locations of cohesin in Saccharomyces cerevisiae.
Bausch C, Noone S, Henry JM, Gaudenz K, Sanderson B, Seidel C, Gerton JL. Bausch C, et al. Mol Cell Biol. 2007 Dec;27(24):8522-32. doi: 10.1128/MCB.01007-07. Epub 2007 Oct 8. Mol Cell Biol. 2007. PMID: 17923700 Free PMC article. - The kinetochore is an enhancer of pericentric cohesin binding.
Weber SA, Gerton JL, Polancic JE, DeRisi JL, Koshland D, Megee PC. Weber SA, et al. PLoS Biol. 2004 Sep;2(9):E260. doi: 10.1371/journal.pbio.0020260. Epub 2004 Jul 27. PLoS Biol. 2004. PMID: 15309047 Free PMC article. - Cohesin relocation from sites of chromosomal loading to places of convergent transcription.
Lengronne A, Katou Y, Mori S, Yokobayashi S, Kelly GP, Itoh T, Watanabe Y, Shirahige K, Uhlmann F. Lengronne A, et al. Nature. 2004 Jul 29;430(6999):573-8. doi: 10.1038/nature02742. Epub 2004 Jun 30. Nature. 2004. PMID: 15229615 Free PMC article. - The nature of meiotic chromosome dynamics and recombination in budding yeast.
Hong S, Joo JH, Yun H, Kim K. Hong S, et al. J Microbiol. 2019 Apr;57(4):221-231. doi: 10.1007/s12275-019-8541-9. Epub 2019 Jan 22. J Microbiol. 2019. PMID: 30671743 Review. - Genome-wide high-resolution chromatin immunoprecipitation of meiotic chromosomal proteins in Saccharomyces cerevisiae.
Kugou K, Ohta K. Kugou K, et al. Methods Mol Biol. 2009;557:285-304. doi: 10.1007/978-1-59745-527-5_18. Methods Mol Biol. 2009. PMID: 19799189 Review.
Cited by
- Genome-wide studies of CCCTC-binding factor (CTCF) and cohesin provide insight into chromatin structure and regulation.
Lee BK, Iyer VR. Lee BK, et al. J Biol Chem. 2012 Sep 7;287(37):30906-13. doi: 10.1074/jbc.R111.324962. Epub 2012 Sep 5. J Biol Chem. 2012. PMID: 22952237 Free PMC article. Review. - Evidence for cohesin sliding along budding yeast chromosomes.
Ocampo-Hafalla M, Muñoz S, Samora CP, Uhlmann F. Ocampo-Hafalla M, et al. Open Biol. 2016 Jun;6(6):150178. doi: 10.1098/rsob.150178. Open Biol. 2016. PMID: 27278645 Free PMC article. - Cohesin dysfunction results in cell wall defects in budding yeast.
Kothiwal D, Gopinath S, Laloraya S. Kothiwal D, et al. Genetics. 2021 Mar 3;217(1):1-16. doi: 10.1093/genetics/iyaa023. Genetics. 2021. PMID: 33683362 Free PMC article. - Cohesin-dependent association of scc2/4 with the centromere initiates pericentromeric cohesion establishment.
Fernius J, Nerusheva OO, Galander S, Alves Fde L, Rappsilber J, Marston AL. Fernius J, et al. Curr Biol. 2013 Apr 8;23(7):599-606. doi: 10.1016/j.cub.2013.02.022. Epub 2013 Mar 14. Curr Biol. 2013. PMID: 23499533 Free PMC article. - Condensin-Dependent Chromatin Compaction Represses Transcription Globally during Quiescence.
Swygert SG, Kim S, Wu X, Fu T, Hsieh TH, Rando OJ, Eisenman RN, Shendure J, McKnight JN, Tsukiyama T. Swygert SG, et al. Mol Cell. 2019 Feb 7;73(3):533-546.e4. doi: 10.1016/j.molcel.2018.11.020. Epub 2018 Dec 27. Mol Cell. 2019. PMID: 30595435 Free PMC article.
References
- Bailey TL, Elkan C. Fitting a mixture model by expectation maximization to discover motifs in biopolymers. Proc Int Conf Intell Syst Mol Biol. 1994;2:28–36. - PubMed
- Bernard P, Maure JF, Partridge JF, Genier S, Javerzat JP, et al. Requirement of heterochromatin for cohesion at centromeres. Science. 2001;294:2539–2542. - PubMed
- Blat Y, Kleckner N. Cohesins bind to preferential sites along yeast chromosome III, with differential regulation along arms versus the centric region. Cell. 1999;98:249–259. - PubMed
- Blat Y, Protacio RU, Hunter N, Kleckner N. Physical and functional interactions among basic chromosome organizational features govern early steps of meiotic chiasma formation. Cell. 2002;111:791–802. - PubMed
Publication types
MeSH terms
Substances
LinkOut - more resources
Full Text Sources
Other Literature Sources
Molecular Biology Databases
