Mechanisms of embryonal tumor initiation: distinct roles for MycN expression and MYCN amplification - PubMed (original) (raw)
Mechanisms of embryonal tumor initiation: distinct roles for MycN expression and MYCN amplification
Loen M Hansford et al. Proc Natl Acad Sci U S A. 2004.
Abstract
The mechanisms causing persistence of embryonal cells that later give rise to tumors is unknown. One tumorigenic factor in the embryonal childhood tumor neuroblastoma is the MYCN protooncogene. Here we show that normal mice developed neuroblast hyperplasia in paravertebral ganglia at birth that completely regressed by 2 weeks of age. In contrast, ganglia from MYCN transgenic (TH-MYCN) mice demonstrated a marked increase in neuroblast hyperplasia and MycN expression during week 1. Regression of neuroblast hyperplasia was then delayed and incomplete before neuroblastoma tumor formation at 6 and 13 weeks in homo- and hemizygote mice, respectively. Paravertebral neuronal cells cultured from perinatal TH-MYCN mice exhibited 3- to 10-fold resistance to nerve growth factor (NGF) withdrawal, compared with normal mice. Both low- and high-affinity NGF receptors were expressed in perinatal neuroblast hyperplasia but not in neuroblastoma tumor tissue. MYCN transgene amplification was present at low levels in perinatal neuroblast hyperplasia from both homo- and hemizygote TH-MYCN mice. However, only in hemizygous mice did tumor formation correlate with a stepwise increase in the frequency of MYCN amplification. These data suggest that inappropriate perinatal MycN expression in paravertebral ganglia cells from TH-MYCN mice initiated tumorigenesis by altering the physiologic process of neural crest cell deletion. Persisting embryonal neural crest cells underwent further changes, such as MYCN amplification and repression of NGF receptor expression, during tumor progression. Our studies provide a model for studying perinatal factors influencing embryonal tumor initiation.
Figures
Fig. 1.
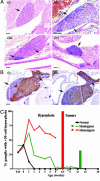
Neuroblast hyperplasia. (A) Photomicrographs of hematoxylin/eosin staining of paravertebral ganglia. Arrows indicate areas of neuroblast hyperplasia. (i) Paravertebral ganglia with no evidence of hyperplasia (3 weeks old). Early neuroblast hyperplasia was identified by clusters of basophilic (blue) neuroblasts in paravertebral ganglia in both day 0 normal (ii) and TH-MYCN (iii) mice. (iv) Advanced hyperplasias from TH-MYCN mice (3 weeks old). (Scale bars, 100 μm.) (B) Immunohistochemical staining in an inferior cervical (stellate) ganglia with hyperplastic lesions from a TH-MYCN mouse (2 weeks old). Arrows indicate advanced hyperplastic lesions. (Scale bar, 100 μm.) (i) Detection of tyrosine hydroxylase expression (TH). (ii) Detection of βIII-tubulin expression. Hyperplastic lesions were negative for both TH and βIII-tubulin, whereas neuronal cells were positive. Isotype IgG controls were negative (data not shown). (C) Percentage of paravertebral ganglia demonstrating hyperplastic lesions in normal and TH-MYCN mice. Hyperplastic lesions were defined as ≥30 cells. Each line represented one of the three genotypes resulting from the crossing of hemizygous TH-MYCN mice. The bar graph indicates tumor incidence among TH-MYCN mice.
Fig. 2.
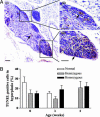
The level of apoptosis in neuroblast hyperplasia. (A) TUNEL immunohistochemical staining for apoptotic cells as indicated by arrows in paravertebral ganglia of 2-week-old TH-MYCN mice, counterstained with hematoxylin. (i) Hyperplastic lesions are boxed (ii and iii) with increased magnification. (Scale bars, 100 μm.) (B) Quantitation of TUNEL-positive cells in hyperplastic lesions of both normal and TH-MYCN mice. Results are expressed as mean values with 95% confidence intervals.
Fig. 3.
MycN expression level in neuroblast hyperplasia. (A) Immunohistochemical staining for MycN expression in tissues from TH-MYCN mice with hematoxylin counterstain. (i) Homogeneous MycN expression in early hyperplasia (2-week-old TH-MYCN mouse). (Scale bar, 20 μm.) (ii) Heterogeneous MycN overexpression in tumors as indicated by arrows from a TH-MYCN mouse. (Scale bar, 100 μm.) (B) Histogram quantifying MycN expression over time in tissues from TH-MYCN mice, compared with MycN staining in tissues from normal mice. Mean values are represented by the fold increase in the percentage of positive cells in hyperplastic lesions when compared with the percentage of positive cells in normal mice. Error bars represent 95% confi-dence intervals.
Fig. 4.
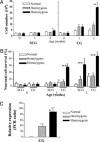
Primary ganglia cell cultures. (A) Viable cell counts after dissociation of ganglia from normal and TH-MYCN mice. Data represent the mean values from five independent experiments; error bars represent 95% confidence intervals. Statistical significance was determined for values from the TH-MYCN mice compared with normal mice at the same age; P < 0.05 (*) and 0.01 (**) were considered significant. (B) Histogram quantifying survival of neurons from SCG and CG after NGF withdrawal. Neuronal cells were scored by counting βIII-tubulin-positive cells in treated wells as a percentage of the NGF-treated control wells. Statistical significance was determined by comparing normal mice with TH-MYCN mice of the same age; P < 0.05 (*) and 0.01 (**) were considered significant. (C) mRNA expression levels of the human MycN transgene. Data are presented as a ratio of the densitometric volume of the PCR product for MycN and the control gene, mouse β-actin. All experiments were performed on at least three independent occasions. Statistical signifi-cance was determined by comparing values for homozygous TH-MYCN mice with those for hemizygous TH-MYCN mice of 2 weeks of age; P < 0.05 (*) and 0.01 (**) were considered significant.
Fig. 5.
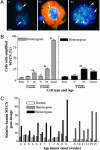
MYCN transgene amplification. (A) MYCN transgene copy number, detected by using a human MYCN cDNA probe (green; indicated by arrow) in a fluorescence in situ hybridization technique and counterstained with DAPI (blue) (scale bar, 5 μm), in control hemizygous TH-MYCN mouse-derived brain cells (i) (2 weeks); hemizygous TH-MYCN mouse-derived CG cells (ii) (2 weeks), with immunocytochemical detection of the neuronal marker βIII-tubulin (red); and hemizygous TH-MYCN mouse-derived tumor cells (iii) (16 weeks). (B) Histogram showing the percentage of cells with MYCN transgene amplification in neurons, neuroblasts, and tumor cells from hemizygous and homozygous TH-MYCN mice. Cell types were distinguished by double labeling with βIII-tubulin. N, neurons; Nb, neuroblasts. Statistical significance was determined by comparing TH-MYCN ganglia cells with TH-MYCN mouse-derived brain cells for mice at the same age and genotype; P < 0.05 (*) and 0.01 (**) were considered significant. (C) Histogram showing the relative MYCN gene amplification by real-time PCR for tissues from normal and TH-MYCN mice.
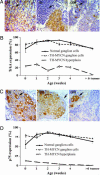
Fig. 6.
NGF receptor expression in paravertebral ganglia. (A) Immunohistochemical staining for expression of the high-affinity NGF receptor, TrkA, using an anti-TrkA antibody. (Scale bar, 20 μm.) (i) A ganglion from a normal mouse (2 weeks); the arrow indicates TrkA expression. (ii) A ganglion with neuroblast hyperplasia from a TH-MYCN mouse (2 weeks); the arrow indicates the area of hyperplasia. (iii) A neuroblastoma tumor from a homozygous TH-MYCN mouse (7 weeks); the arrow indicates a TrkA-positive cell. Isotype IgG controls were negative (data not shown). (B) Graph comparing expression levels of TrkA in ganglia, hyperplasia, and tumor from TH-MYCN mice. Mean values are represented by the percentage of positive cells. Error bars represent 95% confidence intervals. (C) Immunohistochemical staining for expression of the low-affinity NGF receptor, p75, using an anti-p75 antibody. (Scale bar, 20 μm.) (i) A ganglion from a normal mouse (2 weeks); the arrow indicates p75 expression. (ii) A ganglion with neuroblast hyperplasia from a TH-MYCN mouse (2 weeks); the arrow indicates the area of hyperplasia. (iii) A neuroblastoma tumor from a homozygous TH-MYCN mouse (7 weeks); the arrow indicates a p75-positive cell. Isotype IgG controls were negative (data not shown). (D) Graph comparing expression levels of p75 in ganglia, hyperplasia, and tumor from TH-MYCN mice. Mean values are represented by the percentage of positive cells. Error bars represent 95% confidence intervals.
Similar articles
- Tumor development, growth characteristics and spectrum of genetic aberrations in the TH-MYCN mouse model of neuroblastoma.
Rasmuson A, Segerström L, Nethander M, Finnman J, Elfman LH, Javanmardi N, Nilsson S, Johnsen JI, Martinsson T, Kogner P. Rasmuson A, et al. PLoS One. 2012;7(12):e51297. doi: 10.1371/journal.pone.0051297. Epub 2012 Dec 17. PLoS One. 2012. PMID: 23284678 Free PMC article. - ODC1 is a critical determinant of MYCN oncogenesis and a therapeutic target in neuroblastoma.
Hogarty MD, Norris MD, Davis K, Liu X, Evageliou NF, Hayes CS, Pawel B, Guo R, Zhao H, Sekyere E, Keating J, Thomas W, Cheng NC, Murray J, Smith J, Sutton R, Venn N, London WB, Buxton A, Gilmour SK, Marshall GM, Haber M. Hogarty MD, et al. Cancer Res. 2008 Dec 1;68(23):9735-45. doi: 10.1158/0008-5472.CAN-07-6866. Cancer Res. 2008. PMID: 19047152 Free PMC article. - MYCN and ALKF1174L are sufficient to drive neuroblastoma development from neural crest progenitor cells.
Schulte JH, Lindner S, Bohrer A, Maurer J, De Preter K, Lefever S, Heukamp L, Schulte S, Molenaar J, Versteeg R, Thor T, Künkele A, Vandesompele J, Speleman F, Schorle H, Eggert A, Schramm A. Schulte JH, et al. Oncogene. 2013 Feb 21;32(8):1059-65. doi: 10.1038/onc.2012.106. Epub 2012 Apr 9. Oncogene. 2013. PMID: 22484425 - Neuroblastoma and MYCN.
Huang M, Weiss WA. Huang M, et al. Cold Spring Harb Perspect Med. 2013 Oct 1;3(10):a014415. doi: 10.1101/cshperspect.a014415. Cold Spring Harb Perspect Med. 2013. PMID: 24086065 Free PMC article. Review. - MDM2 as MYCN transcriptional target: implications for neuroblastoma pathogenesis.
Slack A, Lozano G, Shohet JM. Slack A, et al. Cancer Lett. 2005 Oct 18;228(1-2):21-7. doi: 10.1016/j.canlet.2005.01.050. Cancer Lett. 2005. PMID: 15927364 Review.
Cited by
- Molecular imaging of neuroblastoma progression in TH-MYCN transgenic mice.
Quarta C, Cantelli E, Nanni C, Ambrosini V, D'ambrosio D, Di Leo K, Angelucci S, Zagni F, Lodi F, Marengo M, Weiss WA, Pession A, Tonelli R, Fanti S. Quarta C, et al. Mol Imaging Biol. 2013 Apr;15(2):194-202. doi: 10.1007/s11307-012-0576-9. Mol Imaging Biol. 2013. PMID: 22777578 Free PMC article. - Murine neuroblastoma cell lines developed by conditional reprogramming preserve heterogeneous phenotypes observed in vivo.
Krawczyk E, Hong SH, Galli S, Trinh E, Wietlisbach L, Misiukiewicz SF, Tilan JU, Chen YS, Schlegel R, Kitlinska J. Krawczyk E, et al. Lab Invest. 2020 Jan;100(1):38-51. doi: 10.1038/s41374-019-0297-7. Epub 2019 Aug 13. Lab Invest. 2020. PMID: 31409888 Free PMC article. - Histone demethylase KDM6B has an anti-tumorigenic function in neuroblastoma by promoting differentiation.
Yang L, Zha Y, Ding J, Ye B, Liu M, Yan C, Dong Z, Cui H, Ding HF. Yang L, et al. Oncogenesis. 2019 Jan 4;8(1):3. doi: 10.1038/s41389-018-0112-0. Oncogenesis. 2019. PMID: 30631055 Free PMC article. - Caffeine Supplementation and FOXM1 Inhibition Enhance the Antitumor Effect of Statins in Neuroblastoma.
Tran GB, Ding J, Ye B, Liu M, Yu Y, Zha Y, Dong Z, Liu K, Sudarshan S, Ding HF. Tran GB, et al. Cancer Res. 2023 Jul 5;83(13):2248-2261. doi: 10.1158/0008-5472.CAN-22-3450. Cancer Res. 2023. PMID: 37057874 Free PMC article. - Generation of murine sympathoadrenergic progenitor-like cells from embryonic stem cells and postnatal adrenal glands.
Saxena S, Wahl J, Huber-Lang MS, Stadel D, Braubach P, Debatin KM, Beltinger C. Saxena S, et al. PLoS One. 2013 May 10;8(5):e64454. doi: 10.1371/journal.pone.0064454. Print 2013. PLoS One. 2013. PMID: 23675538 Free PMC article.
References
- Freeman, R. S., Estus, S. & Johnson, E. M., Jr. (1994) Neuron 12, 343-355. - PubMed
- Woods, W. G., Gao, R. N., Shuster, J. J., Robison, L. L., Bernstein, M., Weitzman, S., Bunin, G., Levy, I., Brossard, J., Dougherty, G., et al. (2002) N. Engl. J. Med. 346, 1041-1046. - PubMed
- Brodeur, G. M. (2003) Nat. Rev. Cancer 3, 203-216. - PubMed
Publication types
MeSH terms
Substances
LinkOut - more resources
Full Text Sources
Other Literature Sources
Medical
Molecular Biology Databases
