Recent translational research: microarray expression profiling of breast cancer--beyond classification and prognostic markers? - PubMed (original) (raw)
Recent translational research: microarray expression profiling of breast cancer--beyond classification and prognostic markers?
Cindy A Wilson et al. Breast Cancer Res. 2004.
Abstract
Genomic expression profiling has greatly improved our ability to subclassify human breast cancers according to shared molecular characteristics and clinical behavior. The logical next question is whether this technology will be similarly useful for identifying the dominant signaling pathways that drive tumor initiation and progression within each breast cancer subtype. A major challenge will be to integrate data generated from the experimental manipulation of model systems with expression profiles obtained from primary tumors. We highlight some recent progress and discuss several obstacles in the use of expression profiling to identify pathway signatures in human breast cancer.
Figures
Figure 1
Cell-type origin model for the classification of human breast cancers. Illustration of the relationship between cell type and of the two main branches of the tumor subclassification schema. ER, estrogen receptor.
Figure 2
ERRB2 and GRB7 co-expression in microarray profiling data from primary breast cancers. The log ratios or log intensity values were downloaded for the ERBB2 and GRB7 probes from each of four publicly available microarray profiling data sets of primary breast cancers. (a) Log10 ratios generated using 60-mer oligonucleotide arrays for the 98 node-negative tumors (78 sporadic tumors and 20 BRCA1/BRCA2 mutant tumors) versus a pooled reference of all 78 sporadic breast cancer RNA from the van't Veer and colleagues data set [11]. (b) Log2 ratios generated using cDNA microarrays for 115 breast cancers and seven nonmalignant breast samples versus a universal reference RNA (mixed human cell lines) from the Sørlie and colleagues data set [4]. (c) Log2 ratios generated from cDNA microarrays for 99 unselected breast cancers versus a universal reference (mixed human cell lines) from the Sotiriou and colleagues data set [5]. (d) Log10 intensity values generated using Affymetrix oligonucleotide arrays for 49 breast cancers from the West and colleagues data set [3].
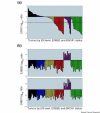
Figure 3
Breast cancer subgroups defined by estrogen receptor message (ESR1) expression, ERRB2 amplification and BRCA1/BRCA2 mutation status. (a) ESR1 values in the van't Veer and colleagues tumor samples [11]. The expression ratios for ESR1, ERRB2 and GRB7 along with the mutational status of BRCA1/BRCA2 were used to delineate the breast cancers into six subgroups. The ERBB2-positive tumors (purple) are grouped separately and arranged from highest to lowest ESR1 level. The samples containing BRCA1 or BRCA2 mutations (dark green) are also grouped separately and arranged from highest to lowest ESR1. The two BRCA2 samples are marked with asterisks. The remaining tumors are arranged by ESR1 level and colored as highly positive (black; ESR log ratio > 0.2), moderately positive (blue; ESR1 > 0 and ESR1 < 0.2), weakly positive (yellow; ESR1 < 0 and ESR1 > -0.5), and negative (red; ESR1 < -0.5). The dotted line represents an estimation of true estrogen receptor (ER) negativity by immunohistochemistry comparison. (b) High ERBB2 expression levels are the result of gene amplification. The samples are arranged in the same order and colored as in (a). Upper, ERRB2 intensity ratios; lower, co-amplified GRB7 intensity ratios.
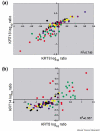
Figure 4
Cell-type-specific cytokeratin expression in breast cancer subgroups. The log ratios for the cytokeratin probes for the van't Veer and colleagues tumor samples [11] are colored by group as in Fig. 3. (a) Co-expression of the luminal KRT8 and KRT18 is found in the estrogen receptor (ER)-positive tumors (black, blue and yellow) and in the ERRB2-positive tumors (purple). (b) Co-expression of the basal KRT5 and KRT14 is found in the ER-negative tumors (red) and in the BRCA1 mutant tumors (dark green).
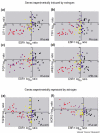
Figure 5
Estrogen-modulated genes and their co-expression in estrogen receptor-positive primary breast cancers. The log ratios of the four experimentally confirmed, estrogen-induced genes (a) LIV-1, (b) TFF1, (c) PGR and (d) AREG were plotted against ESR1 from the van't Veer and colleagues data [11]. Data for genes shown to be repressed by estrogen treatment in MCF-7 cells [8] are also plotted against ESR1: (e) TGFβ2 and (f) NDRG1. The samples are colored by group, as in Figs 3 and 4. Only values for the five subgroups of sporadic tumors (n = 78) are plotted and used for the _R_2 calculations. The data for the BRCA1/BRCA2 subgroup (dark green) are not shown.
Similar articles
- [Prognostic molecular classification of breast cancers based on gene expression profiling].
Feng YM, Li XQ, Sun BC, Gao XC, Gu L, Niu Y, Hao XS. Feng YM, et al. Zhonghua Zhong Liu Za Zhi. 2006 Dec;28(12):900-6. Zhonghua Zhong Liu Za Zhi. 2006. PMID: 17533740 Chinese. - Gene expression profiles of breast cancer obtained from core cut biopsies before neoadjuvant docetaxel, adriamycin, and cyclophoshamide chemotherapy correlate with routine prognostic markers and could be used to identify predictive signatures.
Rody A, Karn T, Gätje R, Kourtis K, Minckwitz G, Loibl S, Munnes M, Ruckhäberle E, Holtrich U, Kaufmann M, Ahr A. Rody A, et al. Zentralbl Gynakol. 2006 Apr;128(2):76-81. doi: 10.1055/s-2006-921508. Zentralbl Gynakol. 2006. PMID: 16673249 Clinical Trial. - High-throughput protein expression analysis using tissue microarray technology of a large well-characterised series identifies biologically distinct classes of breast cancer confirming recent cDNA expression analyses.
Abd El-Rehim DM, Ball G, Pinder SE, Rakha E, Paish C, Robertson JF, Macmillan D, Blamey RW, Ellis IO. Abd El-Rehim DM, et al. Int J Cancer. 2005 Sep 1;116(3):340-50. doi: 10.1002/ijc.21004. Int J Cancer. 2005. PMID: 15818618 - Prognostic applications of gene expression signatures in breast cancer.
Normanno N, De Luca A, Carotenuto P, Lamura L, Oliva I, D'Alessio A. Normanno N, et al. Oncology. 2009;77 Suppl 1:2-8. doi: 10.1159/000258489. Epub 2010 Feb 2. Oncology. 2009. PMID: 20130425 Review. - Microarray-based gene expression profiling as a clinical tool for breast cancer management: are we there yet?
Correa Geyer F, Reis-Filho JS. Correa Geyer F, et al. Int J Surg Pathol. 2009 Aug;17(4):285-302. doi: 10.1177/1066896908328577. Epub 2008 Dec 22. Int J Surg Pathol. 2009. PMID: 19103611 Review.
Cited by
- Genome-wide identification of key modulators of gene-gene interaction networks in breast cancer.
Chiu YC, Wang LJ, Hsiao TH, Chuang EY, Chen Y. Chiu YC, et al. BMC Genomics. 2017 Oct 3;18(Suppl 6):679. doi: 10.1186/s12864-017-4028-4. BMC Genomics. 2017. PMID: 28984209 Free PMC article. - Differential network analysis reveals the genome-wide landscape of estrogen receptor modulation in hormonal cancers.
Hsiao TH, Chiu YC, Hsu PY, Lu TP, Lai LC, Tsai MH, Huang TH, Chuang EY, Chen Y. Hsiao TH, et al. Sci Rep. 2016 Mar 14;6:23035. doi: 10.1038/srep23035. Sci Rep. 2016. PMID: 26972162 Free PMC article. - Puberty-specific promotion of mammary tumorigenesis by a high animal fat diet.
Aupperlee MD, Zhao Y, Tan YS, Zhu Y, Langohr IM, Kirk EL, Pirone JR, Troester MA, Schwartz RC, Haslam SZ. Aupperlee MD, et al. Breast Cancer Res. 2015 Nov 2;17(1):138. doi: 10.1186/s13058-015-0646-4. Breast Cancer Res. 2015. PMID: 26526858 Free PMC article. - Co-modulation analysis of gene regulation in breast cancer reveals complex interplay between ESR1 and ERBB2 genes.
Chiu YC, Wu CT, Hsiao TH, Lai YP, Hsiao C, Chen Y, Chuang EY. Chiu YC, et al. BMC Genomics. 2015;16 Suppl 7(Suppl 7):S19. doi: 10.1186/1471-2164-16-S7-S19. Epub 2015 Jun 11. BMC Genomics. 2015. PMID: 26100352 Free PMC article. - Pubertal high fat diet: effects on mammary cancer development.
Zhao Y, Tan YS, Aupperlee MD, Langohr IM, Kirk EL, Troester MA, Schwartz RC, Haslam SZ. Zhao Y, et al. Breast Cancer Res. 2013;15(5):R100. doi: 10.1186/bcr3561. Breast Cancer Res. 2013. PMID: 24156623 Free PMC article.
References
- Sørlie T, Perou CM, Tibshirani R, Aas T, Geisler S, Johnsen H, Hastie T, Eisen MB, van de Rijn M, Jeffrey SS, et al. Gene expression patterns of breast carcinomas distinguish tumor subclasses with clinical implications. Proc Natl Acad Sci USA. 2001;98:10869–10874. doi: 10.1073/pnas.191367098. - DOI - PMC - PubMed
- Sotiriou C, Neo SY, McShane LM, Korn EL, Long PM, Jazaeri A, Martiat P, Fox SB, Harris AL, Liu ET. Breast cancer classification and prognosis based on gene expression profiles from a population-based study. Proc Natl Acad Sci USA. 2003;100:10393–10398. doi: 10.1073/pnas.1732912100. - DOI - PMC - PubMed
MeSH terms
Substances
LinkOut - more resources
Full Text Sources
Other Literature Sources
Medical


