Chloroplast DNA rearrangements in Campanulaceae: phylogenetic utility of highly rearranged genomes - PubMed (original) (raw)
Comparative Study
Chloroplast DNA rearrangements in Campanulaceae: phylogenetic utility of highly rearranged genomes
Mary E Cosner et al. BMC Evol Biol. 2004.
Abstract
Background: The Campanulaceae (the "hare bell" or "bellflower" family) is a derived angiosperm family comprised of about 600 species treated in 35 to 55 genera. Taxonomic treatments vary widely and little phylogenetic work has been done in the family. Gene order in the chloroplast genome usually varies little among vascular plants. However, chloroplast genomes of Campanulaceae represent an exception and phylogenetic analyses solely based on chloroplast rearrangement characters support a reasonably well-resolved tree.
Results: Chloroplast DNA physical maps were constructed for eighteen representatives of the family. So many gene order changes have occurred among the genomes that characterizing individual mutational events was not always possible. Therefore, we examined different, novel scoring methods to prepare data matrices for cladistic analysis. These approaches yielded largely congruent results but varied in amounts of resolution and homoplasy. The strongly supported nodes were common to all gene order analyses as well as to parallel analyses based on ITS and rbcL sequence data. The results suggest some interesting and unexpected intrafamilial relationships. For example fifteen of the taxa form a derived clade; whereas the remaining three taxa--Platycodon, Codonopsis, and Cyananthus--form the basal clade. This major subdivision of the family corresponds to the distribution of pollen morphology characteristics but is not compatible with previous taxonomic treatments.
Conclusions: Our use of gene order data in the Campanulaceae provides the most highly resolved phylogeny as yet developed for a plant family using only cpDNA rearrangements. The gene order data showed markedly less homoplasy than sequence data for the same taxa but did not resolve quite as many nodes. The rearrangement characters, though relatively few in number, support robust and meaningful phylogenetic hypotheses and provide new insights into evolutionary relationships within the Campanulaceae.
Figures
Figure 1
Linearized cpDNA maps for 18 species (Table 2) of Campanulaceae (plus tobacco) showing order in which the consecutively numbered tobacco probes hybridized. Lines under maps indicate location and extent of IR. Asterisks indicate the position of the putative 23S rDNA duplicative transposition; parenthetical asterisk (*) indicates partial deletion/divergence of the 23S rDNA transposition. Size and location of large insertions designated by "i" followed by size in kb (insertions less than 5 kb not shown).
Figure 2
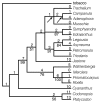
One of six shortest trees obtained in the maximum parsimony analysis of Matrix 1. Tree length is 97 steps; consistency index is 0.81 (with autapomorphies, 0.66 without). The number of character changes is given above the branches and bootstrap values (where greater than 50) are given below. Arrows indicate nodes that collapse in the strict consensus of all six shortest trees.
Figure 3
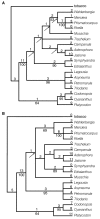
Trees obtained in unweighted (a) and weighted analyses (b) of Matrix 2. Fig. 3a shows one of 241 shortest trees of 93 steps; consistency index is 0.90 (including autapomorphies, 0.78 without). Fig. 3b shows one of 12 shortest trees of 125 steps; consistency index is 0.93 (including autapomorphies, 0.80 without). The number of character changes is given above the branches and bootstrap values are given below. Arrows indicate nodes that collapse in the strict consensus of all the shortest trees.
Figure 4
The two shortest trees obtained in both the unweighted and weighted analyses of Matrix 3. The trees are 87 steps long without weights and 125 steps when weights are applied. The consistency index of the trees in the unweighted analysis is 0.97 (including autapomorphies, 0.92 without); in the analysis with weights applied the CI is 0.97 (including autapomorphies, 0.93 without). Values given on the upper tree (Fig. 4a) pertain to the unweighted analysis, values on the lower tree (Fig. 4b) to the weighted analysis. The number of character changes is given above the branches and bootstrap values are given below. Arrows indicate nodes that collapse in the strict consensus of the shortest trees.
Figure 5
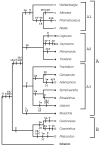
Strict consensus tree of the two equally parsimonious trees from the analysis of Matrix 3 (Fig. 4) showing character changes. Number and type of each change are indicated by e = endpoint, IV = inversion, IS = insertion >5 kb, T = transposition, and D = deletion/divergence. Three of the 84 characters (18, 31 and 37) exhibit homoplasy; each character is an endpoint that changes twice within the tree. Homoplastic changes are shown by the character number below the branch upon which the change occurs. To the right of the tree, brackets and letter/number designations indicate major clades discussed in the text. Symbols at the ends of the terminal branches indicate the geographic distribution of the taxa: □ = eastern Asia; ● = Europe (includes North Africa); ◆ = Americas (primarily North America); * = Southern Hemisphere (mainly Southern Africa).
Figure 6
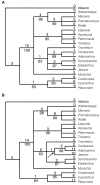
Trees obtained from sequence data. The values below nodes are bootstrap percentages; the values above the nodes indicate the number of changes that occur on that branch. Fig. 6a. The one shortest tree (716 steps) based on ITS sequence data. The CI is 0.69 with autapomorphies and 0.60 without. Fig. 6b. One of the nine shortest trees (338 steps) based on rbcL sequence data, CI = 0.77/0.66. The node that collapses in the strict consensus of the nine trees is marked with an arrow.
Figure 7
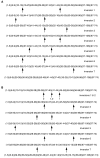
Two alternative models of seven inversions each to explain the evolution of Platycodon cpDNA structure from a tobacco-like ancestor. Numbers in parentheses show order of hybridized tobacco cpDNA probes. Inversion endpoints are shown by the arrows. Locations of regions represented by probes 6-7, 8, and 9 are believed to be the result of transposition [14]; these events are required in addition to the inversions to completely explain the new gene order.
Similar articles
- Phylogeny of Campanuloideae (Campanulaceae) with emphasis on the utility of nuclear pentatricopeptide repeat (PPR) genes.
Crowl AA, Mavrodiev E, Mansion G, Haberle R, Pistarino A, Kamari G, Phitos D, Borsch T, Cellinese N. Crowl AA, et al. PLoS One. 2014 Apr 9;9(4):e94199. doi: 10.1371/journal.pone.0094199. eCollection 2014. PLoS One. 2014. PMID: 24718519 Free PMC article. - Comparative analysis of plastid genomes within the Campanulaceae and phylogenetic implications.
Li CJ, Wang RN, Li DZ. Li CJ, et al. PLoS One. 2020 May 14;15(5):e0233167. doi: 10.1371/journal.pone.0233167. eCollection 2020. PLoS One. 2020. PMID: 32407424 Free PMC article. - accD nuclear transfer of Platycodon grandiflorum and the plastid of early Campanulaceae.
Hong CP, Park J, Lee Y, Lee M, Park SG, Uhm Y, Lee J, Kim CK. Hong CP, et al. BMC Genomics. 2017 Aug 11;18(1):607. doi: 10.1186/s12864-017-4014-x. BMC Genomics. 2017. PMID: 28800729 Free PMC article. - Phylogenetic and biogeographic analyses of the Sino-Himalayan endemic genus Cyananthus (Campanulaceae) and implications for the evolution of its sexual system.
Zhou Z, Hong D, Niu Y, Li G, Nie Z, Wen J, Sun H. Zhou Z, et al. Mol Phylogenet Evol. 2013 Sep;68(3):482-97. doi: 10.1016/j.ympev.2013.04.027. Epub 2013 May 10. Mol Phylogenet Evol. 2013. PMID: 23669010 - Extensive rearrangements in the chloroplast genome of Trachelium caeruleum are associated with repeats and tRNA genes.
Haberle RC, Fourcade HM, Boore JL, Jansen RK. Haberle RC, et al. J Mol Evol. 2008 Apr;66(4):350-61. doi: 10.1007/s00239-008-9086-4. Epub 2008 Mar 11. J Mol Evol. 2008. PMID: 18330485
Cited by
- Comparative genomics revealed new insights into the plastome evolution of Ludwigia (Onagraceae, Myrtales).
Nguyen HD, Do HDK, Vu MT. Nguyen HD, et al. Sci Prog. 2024 Jul-Sep;107(3):368504241272741. doi: 10.1177/00368504241272741. Sci Prog. 2024. PMID: 39150375 Free PMC article. - Comparative Analysis of Complete Chloroplast Genomes of Rubus in China: Hypervariable Regions and Phylogenetic Relationships.
Xu Y, Li Y, Chen Y, Wang L, Xue B, Zhang X, Song W, Guo W, Wu W. Xu Y, et al. Genes (Basel). 2024 May 31;15(6):716. doi: 10.3390/genes15060716. Genes (Basel). 2024. PMID: 38927652 Free PMC article. - A comparative plastome approach enhances the assessment of genetic variation in the Melilotus genus.
Xu P, Meng M, Wu F, Zhang J. Xu P, et al. BMC Genomics. 2024 Jun 3;25(1):556. doi: 10.1186/s12864-024-10476-y. BMC Genomics. 2024. PMID: 38831327 Free PMC article. - Comparative and phylogenetic analysis of the complete chloroplast genomes of ten Pittosporum species from East Asia.
Zhang SD, Ling LZ, Zhang QH. Zhang SD, et al. Funct Integr Genomics. 2024 Mar 22;24(2):64. doi: 10.1007/s10142-024-01344-9. Funct Integr Genomics. 2024. PMID: 38517551
References
- Kovanda M. Campanulaceae. In: Heywood VH, editor. In Flowering Plants of the World. New York: Mayflower Books; 1978. pp. 254–256.
- Takhtajan AL. Systema Magnoliophytorum. Leningrad: Nauka; 1987.
- de Candolle A. Monographie des Campanulêes Paris. 1830.
- Kolakovsky AA. System of the Campanulaceae family from the old world. Bot Zhurnal. 1987;72:1572–1579.
- Fedorov AA. Campanulaceae. In: Shishkin BK, editor. In Flora of the USSR. Moskva-Leningrad: Akademia Nauk SSSR; 1972. pp. 92–324.
Publication types
MeSH terms
Substances
LinkOut - more resources
Full Text Sources
Miscellaneous

