Detecting interregionally diversifying natural selection on modern human cranial form by using matched molecular and morphometric data - PubMed (original) (raw)
Detecting interregionally diversifying natural selection on modern human cranial form by using matched molecular and morphometric data
Charles C Roseman. Proc Natl Acad Sci U S A. 2004.
Abstract
This comparison of morphological and neutral genetic variation in 10 human populations was designed to test a neutral hypothesis of cranial evolution in living and recent humans and to explain deviations from neutrality where detected. Overall, among-population differences in extant Homo sapiens cranial morphology are proportional to among-population differences in neutral molecular characteristics. For most of the populations studied, cranial morphology varies among regions in a manner consistent with neutral expectations. Removal of the effects of shared population history and structure by using the partial Mantel's test, however, does not remove the correlation between some aspects of cranial morphology and a measure of coldness of climate. The excess differentiation is most apparent in those population comparisons that involve a Siberian population living in an extremely cold environment. This finding suggests the action of natural selection, associated with regional variation in temperature, leading to among-population differentiation in excess of neutral expectations for some cranial dimensions. Those dimensions reflect the breadth of the skull, cranial vault size and shape, and aspects of nasal morphology. Although morphology for most of the world appears to vary among populations in accordance with neutral expectations in the context of population structure and history, morphology of the Siberian population appears to have undergone adaptation by natural selection.
Copyright 2004 The National Academy of Sciencs of the USA
Figures
Fig. 1.
The impact of the removal of individual populations from the analysis. The abscissa consists of those populations removed from a given analysis along with the full analysis ordered in terms of the strength of their F vs. Q association represented as Mantel's R on the ordinate. The removal of those populations to the left of the abscissa entry “None” results in higher associations of F and Q than the full analysis, and the removal of those to the right results in lower associations of F and Q. As a means to provide a qualitative assessment of the impact of individual populations on the overall analysis rather than a quantitative comparison of the strength of different evolutionary forces, Mantel's R of Q vs. S controlling for E is also represented.
Fig. 2.
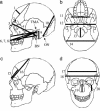
Superimposition of some cranial measurements tabulated in Table 3 onto a generic representation of the human cranium. (a) Ten measurements that have individually calculated Q matrices that are highly associated with F. (b_–_d) Ten measurements that have individually calculated Q matrices that are highly associated with S. Some measurements (i.e., NLH) have been abstracted slightly from their true positions for clarity. Thick lines represent the actual measurements, and thin lines represent lines of reference from which the actual measurements are taken. Relevant osteometric points that are obscured by intervening structures are labeled (TMA, transmeatal axis; BN, basion; and ON, opisthion). Measurements: 1, nasion-bregma subtense; 2, supraorbital projection; 3, simonic subtense; 4, basion-nasion length; 5, subspinale radius; 6, prosthion radius; 7, basion-prosthion length; 8, molar alveolus radius; 9, mastoid height; 10, λ-opisthion chord; 11, minimum cranial breadth; 12, biauricular breadth; 13, foramen magnum length; 14, biasterionic breadth; 15, nasion-subtense fraction; 16, nasion-bregma chord; 17, maximum frontal breadth; 18, maximum cranial breadth; 19, NLH; 20, cheek height.
Fig. 3.
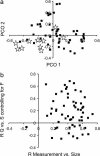
The impact of overall cranial size on the detection of deviations from neutrality. (a) A PCO of the correlation compliment matrix; a plot of PCO 1 vs. PCO 2. Starred measurements are those that have high individual Q vs. S associations controlling for F. (b) A plot of the partial Mantel's statistic (R) for the Q matrix for each measurement vs. the S matrix controlling for F vs. the correlation of each measurement with the log geometric mean of each individual. Only results for males are presented to control confounding effects of size-related sexual dimorphism.
Similar articles
- Climate signatures in the morphological differentiation of worldwide modern human populations.
Hubbe M, Hanihara T, Harvati K. Hubbe M, et al. Anat Rec (Hoboken). 2009 Nov;292(11):1720-33. doi: 10.1002/ar.20976. Anat Rec (Hoboken). 2009. PMID: 19718714 - Moderate climate signature in cranial anatomy of late holocene human populations from Southern South America.
Paula Menéndez L. Paula Menéndez L. Am J Phys Anthropol. 2018 Feb;165(2):309-326. doi: 10.1002/ajpa.23355. Epub 2017 Nov 8. Am J Phys Anthropol. 2018. PMID: 29115678 - Hominoid intraspecific cranial variation mirrors neutral genetic diversity.
Zichello JM, Baab KL, McNulty KP, Raxworthy CJ, Steiper ME. Zichello JM, et al. Proc Natl Acad Sci U S A. 2018 Nov 6;115(45):11501-11506. doi: 10.1073/pnas.1802651115. Epub 2018 Oct 22. Proc Natl Acad Sci U S A. 2018. PMID: 30348789 Free PMC article. - Basicranial influence on overall cranial shape.
Lieberman DE, Pearson OM, Mowbray KM. Lieberman DE, et al. J Hum Evol. 2000 Feb;38(2):291-315. doi: 10.1006/jhev.1999.0335. J Hum Evol. 2000. PMID: 10656780 Review. - The microevolution of modern human cranial variation: implications for hominin and primate evolution.
von Cramon-Taubadel N. von Cramon-Taubadel N. Ann Hum Biol. 2014 Jul-Aug;41(4):323-35. doi: 10.3109/03014460.2014.911350. Epub 2014 May 21. Ann Hum Biol. 2014. PMID: 24846758 Review.
Cited by
- A General Model of the Relationship between the Apportionment of Human Genetic Diversity and the Apportionment of Human Phenotypic Diversity.
Edge MD, Rosenberg NA. Edge MD, et al. Hum Biol. 2015 Oct;87(4):313-337. doi: 10.13110/humanbiology.87.4.0313. Hum Biol. 2015. PMID: 27737590 Free PMC article. - Evidence of different climatic adaptation strategies in humans and non-human primates.
Buck LT, De Groote I, Hamada Y, Hassett BR, Ito T, Stock JT. Buck LT, et al. Sci Rep. 2019 Jul 30;9(1):11025. doi: 10.1038/s41598-019-47202-8. Sci Rep. 2019. PMID: 31363121 Free PMC article. - Reply to Evteev and Heuzé: How to overcome the problem of modeling respiration departing from bony structures.
de Azevedo S, González MF, Cintas C, Ramallo V, Quinto-Sánchez M, Márquez F, Hünemeier T, Paschetta C, Ruderman A, Navarro P, Pazos BA, Silva de Cerqueira CC, Velan O, Ramírez-Rozzi F, Calvo N, Castro HG, Paz RR, González-José R. de Azevedo S, et al. Proc Natl Acad Sci U S A. 2018 May 22;115(21):E4739-E4740. doi: 10.1073/pnas.1804796115. Epub 2018 May 4. Proc Natl Acad Sci U S A. 2018. PMID: 29728465 Free PMC article. No abstract available. - Phenotypic variation in infants, not adults, reflects genotypic variation among chimpanzees and bonobos.
Morimoto N, Ponce de León MS, Zollikofer CP. Morimoto N, et al. PLoS One. 2014 Jul 11;9(7):e102074. doi: 10.1371/journal.pone.0102074. eCollection 2014. PLoS One. 2014. PMID: 25013970 Free PMC article. - Gravettian cranial morphology and human group affinities during the European Upper Palaeolithic.
Mounier A, Heuzé Y, Samsel M, Vasilyev S, Klaric L, Villotte S. Mounier A, et al. Sci Rep. 2020 Dec 14;10(1):21931. doi: 10.1038/s41598-020-78841-x. Sci Rep. 2020. PMID: 33318530 Free PMC article.
References
- Cavalli-Sforza, L. L., Menozzi, P. & Piazza, A. (1994) The History and Geography of Human Genes (Princeton Univ. Press, Princeton, NJ).
- Howells, W. W. (1989) Papers of the Peabody Museum of Archaeology and Ethnology (Harvard University, Cambridge, MA), Vol. 79.
- Whitlock, M. C. (1999) Genet. Res. 74, 215–221. - PubMed
- Konigsberg, L. W. (1988) Am. J. Phys. Anthropol. 77, 471–482. - PubMed
- Konigsberg, L. W. (1990) Hum. Biol. 62, 49–70. - PubMed
MeSH terms
LinkOut - more resources
Full Text Sources


