Using total fluorescence increase (signal mass) to determine the Ca2+ current underlying localized Ca2+ events - PubMed (original) (raw)
Using total fluorescence increase (signal mass) to determine the Ca2+ current underlying localized Ca2+ events
Hui Zou et al. J Gen Physiol. 2004 Sep.
Erratum in
- J Gen Physiol. 2005 Nov;126(5):539
Abstract
The feasibility of determining localized Ca(2+) influx using only wide-field fluorescence images was explored by imaging (using fluo-3) single channel Ca(2+) fluorescence transients (SCCaFTs), due to Ca(2+) entry through single openings of Ca(2+)-permeable ion channels, while recording unitary channel currents. Since the image obtained with wide-field optics is an integration of both in-focus and out-of-focus light, the total fluorescence increase (DeltaF(total) or "signal mass") associated with a SCCaFT can be measured directly from the image by adding together the fluorescence increase due to Ca(2+) influx in all of the pixels. The assumptions necessary for obtaining the signal mass from confocal linescan images are not required. Two- and three-dimensional imaging was used to show that DeltaF(total) is essentially independent of the position of the channel with respect to the focal plane of the microscope. The relationship between Ca(2+) influx and DeltaF(total) was obtained using SCCaFTs from plasma membrane caffeine-activated cation channels when Ca(2+) was the only charge carrier of the inward current. This relationship was found to be linear, with the value of the slope (or converting factor) affected by the particular imaging system set-up, the experimental conditions, and the properties of the fluorescent indicator, including its binding capacity with respect to other cellular buffers. The converting factor was used to estimate the Ca(2+) current passing through caffeine-activated channels in near physiological saline and to estimate the endogenous buffer binding capacity. In addition, it allowed a more accurate estimate of the Ca(2+) current underlying Ca(2+) sparks resulting from Ca(2+) release from intracellular stores via ryanodine receptors in the same preparation.
Figures
Figure 1.
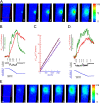
There is a linear relationship between Ca2+ influx and fluorescence “signal mass” (ΔFtotal) that appears not to be affected by the relative position of the transient to the focal plane of the wide-field microscope. An in-focus transient and an out-of-focus transient were detected from the same cell. A series of seven sequential images, starting from the one preceding the channel opening, are displayed for each transient (A for the in-focus and E for the out-of-focus transients). The images were obtained at the time points indicated by the correspondingly numbered arrows in B and D, respectively. Shown in B and D are the measurements associated with the transients: the local fluorescence increase at the channel (ΔF, green trace), the total fluorescence increase (ΔFtotal, red trace) within the color coded boxes, the unitary current record (i, black trace), and the integration of the current (ΔQ, blue trace). During the channel opening, the relationship between ΔQ and ΔFtotal can be fitted by a straight line for both the in-focus transient (r2 = 0.99, maroon colored trace, C) and the out-of-focus transient (r2 = 0.99, indigo colored trace). The slopes are 114 vs. 100 detected photons per femtoCoulomb, respectively. This suggests that there is also a linear relationship between ΔCa and ΔFtotal. For the in-focus transient (B), ΔFtotal increases nearly linearly with time during the channel opening. However, for the out-of-focus transient (D), the rate of rise of ΔFtotal declines after ∼200 ms. From a plot of ΔFtotal versus charge influx over the entire opening, it was determined that most of the decline (∼2/3) is due to the fluorescence from Ca2+-bound fluo-3 extending beyond the measured region and the rest, an increasing number of fast closures. For better visualization of the transients, ΔF images are shown here instead of the raw images from which ΔFtotal was obtained. The areas used to obtain the signal mass measurements are indicated in the left-most images. Images were obtained every 15 ms with an exposure time of 6 ms. Bars, 5 μm. This set of whole-cell recordings from the caffeine-activated channel was obtained with the pipette solution containing (in mM) KCl 130, MgCl2 1, Hepes 20, Na2ATP 3, Na3GTP 1, and fluo-3 pentapotassium salt 0.05 (pH = 7.2); and the bath solution containing (in mM) NaCl 127, KCl 3, CaCl2 1.9, MgCl2 1, and Hepes 10 (pH = 7.4).
Figure 2.
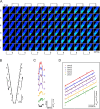
Continuous 3D imaging shows a similar relationship between ΔFtotal and ΔQ from images of a SCCaFT in different focal planes. A SCCaFT was detected using a continuous 3D imaging technique. Restored ΔF/F0 images are shown at different focal planes during the 227 ms from before the channel opened until after the channel closed (A). The 3D restoration was performed using the point spread function acquired by imaging a fluorescent bead with the same protocol. The first image in the sequence is at the top left, acquired near the top of the cell. The image acquisition sequence then runs down the first column (toward the bottom of the cell) and back up the second column and so on, as indicated by the arrows above and below the images with the last image at the bottom right. The channel appears to be located within the top two slices. At an image pixel size of 300 nm square, 3D imaging was accomplished by continuously scanning the focus of the objective lens through the cell. A schematic drawing of the time course of the position of the objective lens is shown in B. Fluorescence images were continuously acquired over a 6-μm depth of the cell as the objective moved at a constant velocity of 0.5 μm/ms. With a 2-ms exposure time, each image represents a 1-μm-thick slice of the cell. The time course of fluorescence changes (ΔF/F0) from the restored images at each plane, measured in a 1.5-μm square box overlaying the transient, were plotted above the current trace (C). ΔFtotal was obtained from the unrestored images at each plane and is plotted versus the total charge accumulated due to the channel opening at the time each image was acquired (D). The slopes of the least squared fits to ΔFtotal versus ΔQ at each level are nearly the same being on average within 1.8% of that of the most in-focus plane (level 5). The slopes (in detected photons/fC) and r2 values for levels 1–6, respectively, are 37.4, 0.94; 37.7, 0.87; 38.8, 0.90; 38.5, 0.94; 39.0, 0.99; and 38.8, 0.99. The ΔFtotal plots for each level were shifted vertically to avoid overlapping. Because of a small amount of hysteresis associated with lens movement, ΔFtotal during the upward excursion is slightly different from that during the downward excursion. Bath and pipette solutions are the same as for Fig. 1.
Figure 3.
Obtaining the converting factor between ΔFtotal and Ca2**+** influx using a known Ca2+ current. (A) Selected images obtained at the times indicated by the correspondingly numbered arrows in B. (B) Local fluorescence increase (ΔF) at the channel (green trace), ΔFtotal (red trace), the Ca2+ current (black trace), and ΔQ (due solely to Ca2+ entry, blue trace) with time associated with the opening of the caffeine-activated channel. The relationship between the total fluorescence increase and total Ca2+ entry, shown for the channel opening defined between the two vertical lines in B, can be fitted by a straight line (r2 = 0.99, C). Indicated in B and C are measurements of ΔFtotal-max and ΔQmax, the values of the total increase in ΔFtotal and ΔQ, respectively, from the time before the channel first opened to the time at the first long closure. The images were acquired every 10 ms with a 10-ms exposure time. Bar, 5 μm. The 90 mM Ca2+ bath solution and the usual pipette solution were used.
Figure 4.
Determination of the fluorescence factor, f, for Ca2**+** -bound fluo-3 molecules. The fluorescence emission is linearly related (r2 = 1.0) to the number of Ca2+-bound fluo-3 molecules. Measurements were obtained from a 100 × 100 pixel area from rectangular glass capillary tubes. For the 60× magnification objective lens (NA = 1.4, used for most of the experiments), f, determined by the slope (Eq. 6a), is 2.34 detected photons per Ca2+-bound fluo-3 molecule. Each point is the mean ± SEM for seven or eight sets of glass capillary tubes. For the 40× magnification objective lens (NA = 1.3), measurements were taken with three sets of glass capillary tubes, yielding a slope of 0.8 detected photons per Ca2+-bound fluo-3 molecule (r2 = 0.998). For measurements for both lenses, the value at each point was usually taken from the average of a number of recordings at 2- and 4-ms exposure times. The pixel size was 0.333 μm; and the light path length, 20 μm. The slopes were normalized for a 10-ms exposure time.
Figure 5.
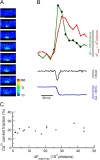
Total fluorescence increase is a valid measurement for Ca2+ entry independent of the duration of the underlying channel opening. A brief, spark-like, fluorescence transient was recorded with the underlying channel opening (or burst time) of ∼12 ms. A series of consecutive images (starting from the one immediately preceding channel opening) is displayed from top to bottom (A). Both ΔF and ΔFtotal are plotted in B against time. The diamond-shaped points in the ΔF trace indicate the time for the sequence of images in A. The rise time of ΔF was 10 ms, change in fluorescence was ∼15%, t1/2 of decay was <20 ms, and the full width at half maximum (FWHM) ∼2 μm at the peak. Because of the filtering, the channel opening in the current trace appeared distorted, and the recorded peak unitary current of 6.8 pA is less than the average peak value of 7.1 pA. We can obtain an average current of at least 4 pA by dividing the total charge influx by the maximum channel open (or burst) time of 12 ms. Because on average 20.2% of the current is carried by Ca2+, the average Ca2+ current passing through the channel is at least 0.81 pA, in the range of the average Ca2+ currents underlying sparks as estimated from the Ca2+ spark signal mass in
discussion
. For a group of 15 transients, there is no apparent relationship (C) between the value of the measured ΔFtotal-max (dependent mainly on the channel open duration) and the fraction of current carried by Ca2+. Standard bath and pipette solutions were used in these experiments. The images were acquired every 10 ms with a 10-ms exposure time. Bar, 5 μm.
Similar articles
- Imaging calcium entering the cytosol through a single opening of plasma membrane ion channels: SCCaFTs--fundamental calcium events.
Zou H, Lifshitz LM, Tuft RA, Fogarty KE, Singer JJ. Zou H, et al. Cell Calcium. 2004 Jun;35(6):523-33. doi: 10.1016/j.ceca.2004.01.019. Cell Calcium. 2004. PMID: 15110142 Review. - Imaging Ca(2+) entering the cytoplasm through a single opening of a plasma membrane cation channel.
Zou H, Lifshitz LM, Tuft RA, Fogarty KE, Singer JJ. Zou H, et al. J Gen Physiol. 1999 Oct;114(4):575-88. doi: 10.1085/jgp.114.4.575. J Gen Physiol. 1999. PMID: 10498675 Free PMC article. - Caffeine-activated large-conductance plasma membrane cation channels in cardiac myocytes: characteristics and significance.
Zhang YA, Tuft RA, Lifshitz LM, Fogarty KE, Singer JJ, Zou H. Zhang YA, et al. Am J Physiol Heart Circ Physiol. 2007 Oct;293(4):H2448-61. doi: 10.1152/ajpheart.00032.2007. Epub 2007 May 4. Am J Physiol Heart Circ Physiol. 2007. PMID: 17483243 - Visualization of Ca2+ entry through single stretch-activated cation channels.
Zou H, Lifshitz LM, Tuft RA, Fogarty KE, Singer JJ. Zou H, et al. Proc Natl Acad Sci U S A. 2002 Apr 30;99(9):6404-9. doi: 10.1073/pnas.092654999. Proc Natl Acad Sci U S A. 2002. PMID: 11983921 Free PMC article. - Ca2+ sparks and Ca2+ waves activate different Ca(2+)-dependent ion channels in single myocytes from rat portal vein.
Mironneau J, Arnaudeau S, Macrez-Lepretre N, Boittin FX. Mironneau J, et al. Cell Calcium. 1996 Aug;20(2):153-60. doi: 10.1016/s0143-4160(96)90104-9. Cell Calcium. 1996. PMID: 8889206 Review.
Cited by
- "Optical patch-clamping": single-channel recording by imaging Ca2+ flux through individual muscle acetylcholine receptor channels.
Demuro A, Parker I. Demuro A, et al. J Gen Physiol. 2005 Sep;126(3):179-92. doi: 10.1085/jgp.200509331. Epub 2005 Aug 15. J Gen Physiol. 2005. PMID: 16103278 Free PMC article. - Relationship between Ca2+ sparklets and sarcoplasmic reticulum Ca2+ load and release in rat cerebral arterial smooth muscle.
Takeda Y, Nystoriak MA, Nieves-Cintrón M, Santana LF, Navedo MF. Takeda Y, et al. Am J Physiol Heart Circ Physiol. 2011 Dec;301(6):H2285-94. doi: 10.1152/ajpheart.00488.2011. Epub 2011 Oct 7. Am J Physiol Heart Circ Physiol. 2011. PMID: 21984539 Free PMC article. - Signal mass and Ca²⁺ kinetics in local calcium events: a modeling study.
Baran I, Ganea C, Ungureanu R, Tofolean IT. Baran I, et al. J Mol Model. 2012 Feb;18(2):721-36. doi: 10.1007/s00894-011-1104-6. Epub 2011 May 12. J Mol Model. 2012. PMID: 21562824 - Somatic mutations of CADM1 in aldosterone-producing adenomas and gap junction-dependent regulation of aldosterone production.
Wu X, Azizan EAB, Goodchild E, Garg S, Hagiyama M, Cabrera CP, Fernandes-Rosa FL, Boulkroun S, Kuan JL, Tiang Z, David A, Murakami M, Mein CA, Wozniak E, Zhao W, Marker A, Buss F, Saleeb RS, Salsbury J, Tezuka Y, Satoh F, Oki K, Udager AM, Cohen DL, Wachtel H, King PJ, Drake WM, Gurnell M, Ceral J, Ryska A, Mustangin M, Wong YP, Tan GC, Solar M, Reincke M, Rainey WE, Foo RS, Takaoka Y, Murray SA, Zennaro MC, Beuschlein F, Ito A, Brown MJ. Wu X, et al. Nat Genet. 2023 Jun;55(6):1009-1021. doi: 10.1038/s41588-023-01403-0. Epub 2023 Jun 8. Nat Genet. 2023. PMID: 37291193 Free PMC article. - Multi-dimensional resolution of elementary Ca2+ signals by simultaneous multi-focal imaging.
Demuro A, Parker I. Demuro A, et al. Cell Calcium. 2008 Apr;43(4):367-74. doi: 10.1016/j.ceca.2007.07.002. Epub 2007 Aug 22. Cell Calcium. 2008. PMID: 17716727 Free PMC article.
References
- Burnashev, N. 1998. Calcium permeability of ligand-gated channels. Cell Calcium. 24:325–332. - PubMed
- Carrington, W.A., and K.E. Fogarty. 1987. 3D molecular distribution if living cells by deconvolution of optical sectioning using light microscopy. Proceedings of the Thirteenth Annual Northeast Bioengineering Conference, IEEE, New York. 1:108–110.
- Carrington, W.A., R.M. Lynch, E.D. Moore, G. Isenberg, K.E. Fogarty, and F.S. Fay. 1995. Superresolution three-dimensional images of fluorescence in cells with minimal light exposure. Science. 268:1483–1487. - PubMed
Publication types
MeSH terms
Substances
LinkOut - more resources
Full Text Sources
Molecular Biology Databases
Miscellaneous


