Most of the extant mtDNA boundaries in south and southwest Asia were likely shaped during the initial settlement of Eurasia by anatomically modern humans - PubMed (original) (raw)
doi: 10.1186/1471-2156-5-26.
Toomas Kivisild, Ene Metspalu, Jüri Parik, Georgi Hudjashov, Katrin Kaldma, Piia Serk, Monika Karmin, Doron M Behar, M Thomas P Gilbert, Phillip Endicott, Sarabjit Mastana, Surinder S Papiha, Karl Skorecki, Antonio Torroni, Richard Villems
Affiliations
- PMID: 15339343
- PMCID: PMC516768
- DOI: 10.1186/1471-2156-5-26
Most of the extant mtDNA boundaries in south and southwest Asia were likely shaped during the initial settlement of Eurasia by anatomically modern humans
Mait Metspalu et al. BMC Genet. 2004.
Abstract
Background: Recent advances in the understanding of the maternal and paternal heritage of south and southwest Asian populations have highlighted their role in the colonization of Eurasia by anatomically modern humans. Further understanding requires a deeper insight into the topology of the branches of the Indian mtDNA phylogenetic tree, which should be contextualized within the phylogeography of the neighboring regional mtDNA variation. Accordingly, we have analyzed mtDNA control and coding region variation in 796 Indian (including both tribal and caste populations from different parts of India) and 436 Iranian mtDNAs. The results were integrated and analyzed together with published data from South, Southeast Asia and West Eurasia.
Results: Four new Indian-specific haplogroup M sub-clades were defined. These, in combination with two previously described haplogroups, encompass approximately one third of the haplogroup M mtDNAs in India. Their phylogeography and spread among different linguistic phyla and social strata was investigated in detail. Furthermore, the analysis of the Iranian mtDNA pool revealed patterns of limited reciprocal gene flow between Iran and the Indian sub-continent and allowed the identification of different assemblies of shared mtDNA sub-clades.
Conclusions: Since the initial peopling of South and West Asia by anatomically modern humans, when this region may well have provided the initial settlers who colonized much of the rest of Eurasia, the gene flow in and out of India of the maternally transmitted mtDNA has been surprisingly limited. Specifically, our analysis of the mtDNA haplogroups, which are shared between Indian and Iranian populations and exhibit coalescence ages corresponding to around the early Upper Paleolithic, indicates that they are present in India largely as Indian-specific sub-lineages. In contrast, other ancient Indian-specific variants of M and R are very rare outside the sub-continent.
Figures
Figure 4
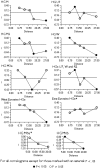
Spatial Autocorrelation Analyses Correlograms of different haplogroups and haplogroup groupings frequencies in South Asia. In the case of haplogroup M3a some datasets had to be excluded because lack of resolution (see footenote for Table 3. for detailes). There was no significant cline in the frequencies of haplogroup R2. In the case of haplogroups M6a and M6b only the potential cline along the Bay of Bengal is investigated. Therefor the number of distance classes is reduced to three.
Figure 2
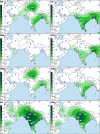
The spatial distribution of Indian-specific mtDNA haplogroups (U2, M4a, M18 and M25) and their sub-haplogroups. In the case of haplogroup M25 some datasets had to be excluded because the discrimination between M* and the respective subgroup was not possible on the basis of the HVS-I data alone (see footnote of Table 3). For other details see legend to Figure 1.
Figure 1
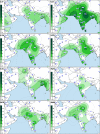
The spatial distribution of Indian-specific mtDNA haplogroups (M2, M6 and M3) and their sub-haplogroups. Maps of South and Southwest Asia depicting the spatial frequency distribution of various Indian-specific mtDNA haplogroups. For India, the tribal populations were excluded (see 'Methods' for explanation). The published (full reference in Table 6, see Additional file 1) and new data were averaged to the resolution of states in India, geographic regions in Iran and provinces in China and Thailand. Numbers adjacent to the data points indicate sample sizes. In the case of haplogroup M3a some datasets had to be excluded because the discrimination between M* and the respective subgroup was not possible on the basis of the HVS-I data alone (see footnote of Table 3).
Figure 3
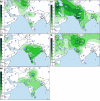
The spatial distribution of Indian-specific mtDNA haplogroups (R5 and R6) and West Eurasian-specific U7, W and R2 in South and southwest Asia. For other details see legend to Figure 1.
Figure 5
Peopling of Eurasia. Map of Eurasia and northeastern Africa depicting the peopling of Eurasia as inferred from the extant mtDNA phylogeny. The bold black arrow indicates the possible "coastal" route of colonization of Eurasia by anatomically modern humans (ca. 60,000 – 80,000 ybp.). This "Southern Coastal Route" is suggested by the phylogeography of mtDNA haplogroup M, the virtual absence of which in the Near East and Southwest Asia undermines the likelihood of the initial colonization of Eurasia taking a route north around the Red Sea. Therefore, the initial split between West and East Eurasian mtDNAs is postulated between the Indus Valley and Southwest Asia. Spheres depict expansion zones where, after the initial (coastal) peopling of the continent, local branches of the mtDNA tree (haplogroups given in the spheres) arose (ca. 40,000 – 60,000 ybp), and from where they where further carried into the interior of the continent (thinner black arrows). Admixture between the expansion zones has been surprisingly limited ever since. We note that while there is no obvious need to introduce the "northern route" – from northeast Africa over Sinai to the Near East – to explain the initial colonization of Eurasia, the spread of some mtDNA and Y-chromosomal haplogroups implies that the "northern" passage might have been used in a later period [33, 34].
Figure 6
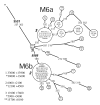
Network of HVS-I haplotypes belonging to haplogroup M6. Circle areas are proportional to haplotype frequencies. Variant bases of the HVS-I are numbered as in (Anderson et al. 1981) minus 16,000 and shown along links between haplotypes. Character changes are specified only for transversions. Underlined samples are those in which the diagnostic coding region markers (3537 and 5585) were assayed by either RFLP analysis (M6: -3537 AluI; M6b: -5584 AluI) or direct sequencing. Sample codes are as in Table 6 (see Additional file 1). Coalescence estimates marked with an asterisk are calculated excluding tribal populations (see Materials and Methods for explanation). The coalescence estimate marked with two asterisks is calculated without the data on tribal and scheduled caste (the Mukri) populations (see text for details).
Figure 7
A network of haplogroup M3a haplotypes. Underlined samples are those in which the diagnostic coding region marker (4580) of M3a was assayed by either RFLP analysis (-4577 NlaIII) or direct sequencing. For other details, see the legend to Figure 6.
Figure 8
Network of HVS-I haplotypes belonging to haplogroup M4a. Underlined samples are those in which the diagnostic coding region marker (6620) of M4a was assayed by either RFLP analysis (+6618 MboI) or direct sequencing. For other details, see the legend to Figure 6.
Figure 9
Network of HVS-I haplotypes belonging to haplogroup M18. For other details, see the legend to Figure 6
Figure 10
Network of HVS-I haplotypes belonging to haplogroup M25. Underlined samples are those in which the diagnostic coding region marker (15928) of M25 was assayed by either RFLP analysis (-15925 MspI) or direct sequencing. For other details, see the legend to Figure 6.
Figure 11
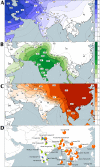
The segregation of West Eurasian, East Eurasian and South Asian mtDNA pools. Partial map of Eurasia illustrating the spatial frequency distribution of mtDNA haplogroups native to West Eurasia (panel A), South Asia (panel B) and East Eurasia (panel C). Data points represent states in India, geographic divisions in Iran and provinces in China and Thailand. Numbers adjacent to the data points indicate the applicable sample size. The distribution of West Eurasian-, South Asian- and East Eurasian-specific mtDNA haplogroups amongst the tribal populations of South and Southeast Asia are depicted as pie diagrams on panel D (colors as on panels A, B, and C, while the white color represents unclassified M* and R* mtDNAs). The data on tribal populations was not used for the isofrequency maps of panels A, B and C (see Materials and Methods for explanation).
Similar articles
- High-resolution mtDNA studies of the Indian population: implications for palaeolithic settlement of the Indian subcontinent.
Barnabas S, Shouche Y, Suresh CG. Barnabas S, et al. Ann Hum Genet. 2006 Jan;70(Pt 1):42-58. doi: 10.1111/j.1529-8817.2005.00207.x. Ann Hum Genet. 2006. PMID: 16441256 - Peopling of South Asia: investigating the caste-tribe continuum in India.
Chaubey G, Metspalu M, Kivisild T, Villems R. Chaubey G, et al. Bioessays. 2007 Jan;29(1):91-100. doi: 10.1002/bies.20525. Bioessays. 2007. PMID: 17187379 - Admixture, migrations, and dispersals in Central Asia: evidence from maternal DNA lineages.
Comas D, Plaza S, Wells RS, Yuldaseva N, Lao O, Calafell F, Bertranpetit J. Comas D, et al. Eur J Hum Genet. 2004 Jun;12(6):495-504. doi: 10.1038/sj.ejhg.5201160. Eur J Hum Genet. 2004. PMID: 14872198 - Ancient and modern mitochondrial DNA sequences and the colonization of the Pacific.
Hagelberg E. Hagelberg E. Electrophoresis. 1997 Aug;18(9):1529-33. doi: 10.1002/elps.1150180907. Electrophoresis. 1997. PMID: 9378116 Review. - African human mtDNA phylogeography at-a-glance.
Rosa A, Brehem A. Rosa A, et al. J Anthropol Sci. 2011;89:25-58. doi: 10.4436/jass.89006. Epub 2011 Mar 15. J Anthropol Sci. 2011. PMID: 21368343 Review.
Cited by
- West Eurasian mtDNA lineages in India: an insight into the spread of the Dravidian language and the origins of the caste system.
Palanichamy MG, Mitra B, Zhang CL, Debnath M, Li GM, Wang HW, Agrawal S, Chaudhuri TK, Zhang YP. Palanichamy MG, et al. Hum Genet. 2015 Jun;134(6):637-47. doi: 10.1007/s00439-015-1547-4. Epub 2015 Apr 2. Hum Genet. 2015. PMID: 25832481 Clinical Trial. - Phylogeographic analysis of mitochondrial DNA in northern Asian populations.
Derenko M, Malyarchuk B, Grzybowski T, Denisova G, Dambueva I, Perkova M, Dorzhu C, Luzina F, Lee HK, Vanecek T, Villems R, Zakharov I. Derenko M, et al. Am J Hum Genet. 2007 Nov;81(5):1025-41. doi: 10.1086/522933. Epub 2007 Oct 1. Am J Hum Genet. 2007. PMID: 17924343 Free PMC article. - The Genetic Ancestry of Modern Indus Valley Populations from Northwest India.
Pathak AK, Kadian A, Kushniarevich A, Montinaro F, Mondal M, Ongaro L, Singh M, Kumar P, Rai N, Parik J, Metspalu E, Rootsi S, Pagani L, Kivisild T, Metspalu M, Chaubey G, Villems R. Pathak AK, et al. Am J Hum Genet. 2018 Dec 6;103(6):918-929. doi: 10.1016/j.ajhg.2018.10.022. Am J Hum Genet. 2018. PMID: 30526867 Free PMC article. - Contrasting maternal and paternal genetic histories among five ethnic groups from Khyber Pakhtunkhwa, Pakistan.
Tariq M, Ahmad H, Hemphill BE, Farooq U, Schurr TG. Tariq M, et al. Sci Rep. 2022 Jan 19;12(1):1027. doi: 10.1038/s41598-022-05076-3. Sci Rep. 2022. PMID: 35046511 Free PMC article. - The congruence between matrilineal genetic (mtDNA) and geographic diversity of Iranians and the territorial populations.
Bahmanimehr A, Eskandari G, Nikmanesh F. Bahmanimehr A, et al. Iran J Basic Med Sci. 2015 Jan;18(1):30-7. Iran J Basic Med Sci. 2015. PMID: 25810873 Free PMC article.
References
- Torroni A, Miller JA, Moore LG, Zamudio S, Zhuang J, Droma T, Wallace DC. Mitochondrial DNA analysis in Tibet: implications for the origin of the Tibetan population and its adaptation to high altitude. Am J Phys Anthropol. 1994;93:189–199. - PubMed
MeSH terms
Substances
LinkOut - more resources
Full Text Sources
