Diabetes and diabetes-associated lipid abnormalities have distinct effects on initiation and progression of atherosclerotic lesions - PubMed (original) (raw)
Diabetes and diabetes-associated lipid abnormalities have distinct effects on initiation and progression of atherosclerotic lesions
Catherine B Renard et al. J Clin Invest. 2004 Sep.
Abstract
Diabetes in humans accelerates cardiovascular disease caused by atherosclerosis. The relative contributions of hyperglycemia and dyslipidemia to atherosclerosis in patients with diabetes are not clear, largely because there is a lack of suitable animal models. We therefore have developed a transgenic mouse model that closely mimics atherosclerosis in humans with type 1 diabetes by breeding low-density lipoprotein receptor-deficient mice with transgenic mice in which type 1 diabetes can be induced at will. These mice express a viral protein under control of the insulin promoter and, when infected by the virus, develop an autoimmune attack on the insulin-producing beta cells and subsequently develop type 1 diabetes. When these mice are fed a cholesterol-free diet, diabetes, in the absence of associated lipid abnormalities, causes both accelerated lesion initiation and increased arterial macrophage accumulation. When diabetic mice are fed cholesterol-rich diets, on the other hand, they develop severe hypertriglyceridemia and advanced lesions, characterized by extensive intralesional hemorrhage. This progression to advanced lesions is largely dependent on diabetes-induced dyslipidemia, because hyperlipidemic diabetic and nondiabetic mice with similar plasma cholesterol levels show a similar extent of atherosclerosis. Thus, diabetes and diabetes-associated lipid abnormalities have distinct effects on initiation and progression of atherosclerotic lesions.
Figures
Figure 1
Diabetic mice demonstrated hyperglycemia throughout the study, and their metabolic control was improved by intense insulin therapy. Female LDLR–/–;GP littermate mice were injected with saline (nondiabetic) or LCMV (diabetic) 1 week prior to changing the diet at week 0. The diets contained 0%, 0.12%, or 0.5% cholesterol (see key). One group of diabetic mice was treated with an intense insulin therapy (intense insulin) and fed the cholesterol-free diet. Blood glucose was measured at the indicated times. The number of animals per group is indicated within parentheses. NS, nonsignificant versus nondiabetic mice fed the cholesterol-free diet. *P < 0.05, **P < 0.01, ***P < 0.001.
Figure 2
Diabetic mice exhibited severe insulitis and loss of immunoreactive insulin in β cells. Thirteen weeks after LCMV or saline injection, the pancreata of nondiabetic (A and B) and diabetic (C and D) mice were dissected, embedded, cross-sectioned, and stained with H&E (A and C). Immunoreactive insulin was detected by using a mouse monoclonal anti–insulin antibody in adjacent sections. This procedure results in a brown reaction product (B and D). The procedure was performed on 3–4 mice per group with similar results.
Figure 3
Diabetic mice fed cholesterol-rich diets developed diabetes-associated lipid abnormalities, while diabetic mice fed a cholesterol-free diet had no diabetes-induced lipid abnormalities. Plasma cholesterol profiles of nondiabetic and diabetic mice fed different diets were analyzed by FPLC (A, C, and D). A 100-μl aliquot of plasma obtained after 12 weeks on the diet was applied to a column filled with Superose 6HR. Each 250-μl fraction was subjected to cholesterol analysis. The results are presented as mean + SEM (A, C, and D) and mean ± SEM (B) of plasma samples obtained from 3 different animals. The major lipoprotein peaks (VLDL, LDL, and HDL) are indicated. Susceptibility of LDL to copper oxidation was measured in LDL fractions isolated from nondiabetic and diabetic mice fed the cholesterol-free diet (B). The appearance (lag phase and rate of formation) of conjugated dienes was measured by a spectrophotometer. Chol., cholesterol.
Figure 4
Diabetes caused a greater degree of atherosclerosis regardless of dietary cholesterol content (shown as percentage). After 12 weeks on diet, diabetic and nondiabetic LDLR–/–;GP mice were killed by cardiac perfusion and their tissues fixed. The aorta was dissected, and the area covered by atherosclerotic lesions was identified by Sudan IV staining and image analysis. Results are expressed as mean + SEM (A and C) or as scatter plots (B). In C, subgroups of cholesterol-fed nondiabetic and diabetic mice with similar plasma cholesterol levels were selected for comparison of lesion area. The number of mice per group is indicated above each bar in A and C. Statistical analysis was performed by using unpaired Student’s t test or one-way ANOVA followed by the Newman-Keuls multiple-comparison test (*P < 0.05, **P < 0.01, and ***P < 0.001 for comparison of groups within brackets). Symbols in B are defined in Figure 1.
Figure 5
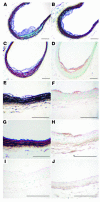
Diabetes caused lesion initiation in mice fed a cholesterol-free diet. Diabetic LDLR–/–;GP mice fed the 0% cholesterol diet (A–F, H–I) and nondiabetic LDLR–/–;GP littermates fed the 0% cholesterol diet (G and J) were perfusion fixed after 12 weeks on diet, as described in Figure 4. The BCA was dissected, paraffin embedded, and serial sectioned until maximal lesion size was identified. Sections were stained using a Movat’s pentachrome procedure (A–C, E, and G). Black represents nuclei and elastin, yellow represents collagen and reticular fibers, blue represents glycosaminoglycans, red represents muscle, and intense red represents fibrinoid and fibrin (hemorrhage). Some sections were used to detect macrophages (D and F), by using a rat monoclonal Mac-2 antibody, and others were used to detect AGEs (H and J) or used as negative controls (I). Representative sections are shown. Scale bars: 100 μm.
Figure 6
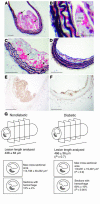
Diabetes caused advanced lesions in mice fed cholesterol-rich diets. Diabetic LDLR–/–;GP mice fed the 0.12% cholesterol diet (A, B, and E), or 0.5% cholesterol diet (C), and nondiabetic LDLR–/–;GP littermates fed the 0.12% cholesterol diet (F) or the 0.5% cholesterol diet (D) were perfusion fixed after 12 weeks on diet, as described in Figure 4. The BCA was dissected, paraffin embedded, and serial sectioned until maximal lesion size was identified. Sections were stained using a Movat’s pentachrome procedure (A–D). Black represents nuclei and elastin, yellow represents collagen and reticular fibers, blue represents glycosaminoglycans, red represents muscle, and intense red represents fibrinoid and fibrin (hemorrhage). Some sections were used to detect AGEs (E and F). Representative sections are shown. Note the intralesional hemorrhage (marked by arrows) in A and C. In B, erythrocytes in the lesion are indicated by open arrows. Scale bars: 100 μm (A, C–F); 20 μm (B). (G) A graphical representation of frequency of hemorrhage in lesions of similar size from diabetic and nondiabetic mice.
Figure 7
The combination of diabetes and cholesterol-rich diet caused occlusion of coronary microvessels and lipid embolism. Blocked coronary arteries and lipid embolism probably caused death in diabetic mice fed cholesterol-rich diets. (A) A Movat’s stained advanced lesion with cholesterol clefts and fibrous cap in the extension of the aortic sinus into the coronary arteries from a diabetic mouse. This mouse died after 11 weeks on the 0.12% cholesterol diet. (B) H&E staining of occluding intramyocardial lesions at the time of death from a diabetic mouse fed the 0.12% cholesterol diet for 11 weeks. (C) An aorta completely occluded by lipid at the time of death from a diabetic mouse fed the 0.5% cholesterol diet for 9 weeks. Analysis of cross sections stained with Oil red O confirmed that the aorta was completely occluded by lipid at a site without a lesion. (D) The same aorta as in C stained with Sudan IV. Scale bars: 100 μm (A); 20 μm (B); and 1 mm (C).
Comment in
- Why does diabetes increase atherosclerosis? I don't know!
Goldberg IJ. Goldberg IJ. J Clin Invest. 2004 Sep;114(5):613-5. doi: 10.1172/JCI22826. J Clin Invest. 2004. PMID: 15343377 Free PMC article.
Similar articles
- Addition of dietary fat to cholesterol in the diets of LDL receptor knockout mice: effects on plasma insulin, lipoproteins, and atherosclerosis.
Wu L, Vikramadithyan R, Yu S, Pau C, Hu Y, Goldberg IJ, Dansky HM. Wu L, et al. J Lipid Res. 2006 Oct;47(10):2215-22. doi: 10.1194/jlr.M600146-JLR200. Epub 2006 Jul 13. J Lipid Res. 2006. PMID: 16840797 - Effects of High Fat Feeding and Diabetes on Regression of Atherosclerosis Induced by Low-Density Lipoprotein Receptor Gene Therapy in LDL Receptor-Deficient Mice.
Willecke F, Yuan C, Oka K, Chan L, Hu Y, Barnhart S, Bornfeldt KE, Goldberg IJ, Fisher EA. Willecke F, et al. PLoS One. 2015 Jun 5;10(6):e0128996. doi: 10.1371/journal.pone.0128996. eCollection 2015. PLoS One. 2015. PMID: 26046657 Free PMC article. - Effect of streptozotocin-induced hyperglycemia on lipid profiles, formation of advanced glycation endproducts in lesions, and extent of atherosclerosis in LDL receptor-deficient mice.
Reaven P, Merat S, Casanada F, Sutphin M, Palinski W. Reaven P, et al. Arterioscler Thromb Vasc Biol. 1997 Oct;17(10):2250-6. doi: 10.1161/01.atv.17.10.2250. Arterioscler Thromb Vasc Biol. 1997. PMID: 9351397 - Mouse models of atherosclerosis.
Breslow JL. Breslow JL. Science. 1996 May 3;272(5262):685-8. doi: 10.1126/science.272.5262.685. Science. 1996. PMID: 8614828 Review. - Do glucose and lipids exert independent effects on atherosclerotic lesion initiation or progression to advanced plaques?
Kanter JE, Johansson F, LeBoeuf RC, Bornfeldt KE. Kanter JE, et al. Circ Res. 2007 Mar 30;100(6):769-81. doi: 10.1161/01.RES.0000259589.34348.74. Circ Res. 2007. PMID: 17395883 Review.
Cited by
- Dual-trajectory of TyG levels and lifestyle scores and their associations with ischemic stroke in a non-diabetic population: a cohort study.
Zhou H, Ding X, Lan Y, Fang W, Yuan X, Tian Y, Chen S, Wu S, Wu D. Zhou H, et al. Cardiovasc Diabetol. 2024 Jun 28;23(1):225. doi: 10.1186/s12933-024-02313-z. Cardiovasc Diabetol. 2024. PMID: 38943172 Free PMC article. - Imbalance of APOB Lipoproteins and Large HDL in Type 1 Diabetes Drives Atherosclerosis.
Kothari V, Ho TWW, Cabodevilla AG, He Y, Kramer F, Shimizu-Albergine M, Kanter JE, Snell-Bergeon J, Fisher EA, Shao B, Heinecke JW, Wobbrock JO, Lee WL, Goldberg IJ, Vaisar T, Bornfeldt KE. Kothari V, et al. Circ Res. 2024 Jul 5;135(2):335-349. doi: 10.1161/CIRCRESAHA.123.323100. Epub 2024 Jun 3. Circ Res. 2024. PMID: 38828596 Free PMC article. - Elevated apolipoprotein C3 augments diabetic kidney disease and associated atherosclerosis in type 2 diabetes.
Cervantes J, Koska J, Kramer F, Akilesh S, Alpers CE, Mullick AE, Reaven P, Kanter JE. Cervantes J, et al. JCI Insight. 2024 May 14;9(12):e177268. doi: 10.1172/jci.insight.177268. JCI Insight. 2024. PMID: 38743496 Free PMC article. - Effects of subcutaneous vs. oral nanoparticle-mediated insulin delivery on hemostasis disorders in type 1 diabetes: A rat model study.
Kaddour N, Benyettou F, Moulai K, Mebarki A, Allal-Taouli K, Ghemrawi R, Whelan J, Merzouk H, Trabolsi A, Mokhtari-Soulimane NA. Kaddour N, et al. Heliyon. 2024 Apr 27;10(9):e30450. doi: 10.1016/j.heliyon.2024.e30450. eCollection 2024 May 15. Heliyon. 2024. PMID: 38711655 Free PMC article. - Protective Factors and the Pathogenesis of Complications in Diabetes.
Yu MG, Gordin D, Fu J, Park K, Li Q, King GL. Yu MG, et al. Endocr Rev. 2024 Mar 4;45(2):227-252. doi: 10.1210/endrev/bnad030. Endocr Rev. 2024. PMID: 37638875 Free PMC article. Review.
References
- Kannel WB, McGee DL. Diabetes and cardiovascular disease: The Framingham study. JAMA. 1979;241:2035–2038. - PubMed
- The Diabetes ControlComplications Trial Research Group.1993.The effects of intensive treatment of diabetes on the development and progression of long-term complications of insulin-dependent diabetes mellitus.N. Engl. J. Med.329:977–986. - PubMed
- Oldstone MBA, Nerenberg M, Southern P, Price J, Lewicki H. Virus infection triggers insulin-dependent diabetes mellitus in a transgenic model: role of anti-self (virus) immune response. Cell. 1991;65:319–331. - PubMed
- Ohashi P, et al. Ablation of tolerance and induction of diabetes by virus infection in viral antigen transgenic mice. Cell. 1991;65:305–310. - PubMed
- von Herrath MG, Dockter J, Oldstone MB. How virus induces a rapid or slow onset insulin-dependent diabetes mellitus in a transgenic model. Immunity. 1994;1:231–242. - PubMed
Publication types
MeSH terms
Substances
Grants and funding
- HL62887/HL/NHLBI NIH HHS/United States
- DK02456/DK/NIDDK NIH HHS/United States
- 32HL07820/HL/NHLBI NIH HHS/United States
- AG04342/AG/NIA NIH HHS/United States
- R01 HL062887/HL/NHLBI NIH HHS/United States
- HL076719/HL/NHLBI NIH HHS/United States
- DK51091/DK/NIDDK NIH HHS/United States
- R01 HL076719/HL/NHLBI NIH HHS/United States
- R29 DK051091/DK/NIDDK NIH HHS/United States
- R01 DK051091/DK/NIDDK NIH HHS/United States
- P01 DK002456/DK/NIDDK NIH HHS/United States
- P30 DK035816/DK/NIDDK NIH HHS/United States
- P01 AG004342/AG/NIA NIH HHS/United States
- DK035816/DK/NIDDK NIH HHS/United States
- T32 HL007820/HL/NHLBI NIH HHS/United States
- P30 DK17047/DK/NIDDK NIH HHS/United States
- P30 DK017047/DK/NIDDK NIH HHS/United States
LinkOut - more resources
Full Text Sources
Molecular Biology Databases


