Roles of the mammalian mitochondrial fission and fusion mediators Fis1, Drp1, and Opa1 in apoptosis - PubMed (original) (raw)
Roles of the mammalian mitochondrial fission and fusion mediators Fis1, Drp1, and Opa1 in apoptosis
Yang-ja Lee et al. Mol Biol Cell. 2004 Nov.
Abstract
During apoptosis, the mitochondrial network fragments. Using short hairpin RNAs for RNA interference, we manipulated the expression levels of the proteins hFis1, Drp1, and Opa1 that are involved in mitochondrial fission and fusion in mammalian cells, and we characterized their functions in mitochondrial morphology and apoptosis. Down-regulation of hFis1 powerfully inhibits cell death to an extent significantly greater than down-regulation of Drp1 and at a stage of apoptosis distinct from that induced by Drp1 inhibition. Cells depleted of Opa1 are extremely sensitive to exogenous apoptosis induction, and some die spontaneously by a process that requires hFis1 expression. Wild-type Opa1 may function normally as an antiapoptotic protein, keeping spontaneous apoptosis in check. However, if hFis1 is down-regulated, cells do not require Opa1 to prevent apoptosis, suggesting that Opa1 may be normally counteracting the proapoptotic action of hFis1. We also demonstrate in this study that mitochondrial fragmentation per se does not result in apoptosis. However, we provide further evidence that multiple components of the mitochondrial morphogenesis machinery can positively and negatively regulate apoptosis.
Figures
Figure 1.
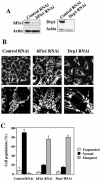
Knockdown of hFis1 or Drp1 expression induces mitochondrial fusion. HeLa cells were transfected with pREP4 constructs containing shRNA of the target sequence of hFis1, Drp1, or control, and the transfectants were selected by growth in media containing hygromycin B. (A) Total cell lysates from the hFis1 RNAi cells, Drp1 RNAi cells, and control RNAi cells were prepared, and the expression levels of hFis1 and Drp1 were analyzed by Western blotting. Actin level also was analyzed for a loading control. (B) Mitochondria of control RNAi cells, hFis1 RNAi cells, or Drp1 RNAi cells were visualized with Mitotracker Red CMXRos and analyzed by confocal microscopy. Enlargements are shown for detailed structure of mitochondria. An arrow shows a typical balloon-like structure in Drp1 RNAi cells. (C) Percentage of cell population with fragmented (dotted), normal (solid), or elongated (striped) mitochondria in control RNAi, hFis1 RNAi, or Drp1 RNAi culture. At least 200 cells in several fields were counted in each experiment. Data represent the mean ± SD of at least three independent experiments.
Figure 2.
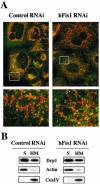
Knockdown of hFis1 did not affect the distribution of Drp1 to mitochondria. (A) Control or hFis1-depleted HeLa cells were incubated with Mitotracker CMXRos (red) for 20 min before fixation and stained with mouse monoclonal anti-DLP1/Drp1 followed by anti-mouse Alexa Fluor 488 antibodies (green). Mitochondria and distribution of Drp1 were analyzed by confocal microscopy. Red, mitochondria; green, Drp1. (B) HeLa cells depleted of hFis1 along with control RNAi were fractionated into S and HM (mainly mitochondria) and analyzed for the distribution of Drp1 by Western blotting. Fractionation quality was verified by the distribution of specific subcellular markers: CoxIV for mitochondria and actin for cytosol.
Figure 3.
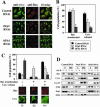
hFis1 depletion produces greater resistance to apoptosis than depletion of Drp1. (A) HeLa cells depleted of hFis1 or Drp1 by RNAi along with control RNAi cells were treated with STS (1 μM; 6 h), Act D (10 μM; 8 h), etoposide (100 μM; 30 h), or anti-Fas antibody (500 ng/ml, 15 h), and the nuclei were stained with Hoechst 33342 (1 μg/ml; 15 min at RT). Normal or apoptotic nuclei of these cells in several fields were counted under the fluorescent microscope (for UV excitation). At least 200 cells altogether in each treatment were counted and shown as a percentage of cells with apoptotic nuclei among total cells counted. The data are plotted as the mean ± SD of at least three independent experiments. (B) PARP cleavage was analyzed in the total extracts from HeLa cells depleted of hFis1, Drp1, and control, which were treated with STS (1 μM; 0, 3, 6 h), Act D (10 μM; 0, 4, 8 h), or anti-Fas (500 ng/ml; 0, 6, 15 h). The figure is a representative of at least three independent experiments.
Figure 4.
Both Bax translocation and cytochrome c release induced by actinomycin D are inhibited in hFis1-depleted HeLa cells, whereas cytochrome c release, but not Bax translocation, is inhibited in Drp1-depleted cells. (A) HeLa cells depleted of hFis1 or Drp1 by RNAi along with control RNAi cells were treated with Act D (10 μM; 8 h) in the presence of zVAD-fmk (50 μM), fixed, and double stained with anti-Bax (rabbit polyclonal, red) and anti-cytochrome c (mouse monoclonal, green) antibodies. (B) The number of cells displaying Bax translocation or cytochrome c release was counted and plotted as a percentage of total cells counted in each RNAi cell population that had been treated with Act D and stained with anti-Bax and anti-cytochrome c (the same samples as shown in A). At least 200 cells were counted altogether in several fields. Data are plotted as the mean ± SD of at least three independent experiments. (C) A unique group of cells (Bax had translocated but cytochrome c was not released) was seen in Drp1 RNAi cells. Four groups of cells were counted in each RNAi cell population that had been treated with Act D (the same samples as in A): i) Bax did not translocate and cytochrome c was not released; ii) Bax translocated, but cytochrome c is not released; iii) Bax not translocated, but cytochrome c is released; and iv) Bax translocated and cytochrome c is released were plotted as a percentage of total cells counted in each RNAi cell population. There were no cells categorized as iii, so only i, ii, and iv were plotted. Bars are labeled solid or striped, as in B. Data were plotted as the mean ± SD of at least three independent experiments. (D) HeLa cells depleted of Drp1 or hFis1 along with control RNAi were incubated with or without Act D (10 μM) for 8 h, fractionated into S and HM (mainly mitochondria), and analyzed for the distribution of Bax and cytochrome c by Western blotting. Fractionation quality was verified by the distribution of specific subcellular markers: CoxIV for mitochondria and actin for cytosol. To confirm the depletion of proteins (hFis1 and Drp1) and their localizations, hFis1 and Drp1 also were examined. The figure shown is representative of three independent experiments.
Figure 5.
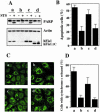
Overexpression of hFis1 wild-type (hFis1 wt) but not C terminus-truncated mutant (hFis1 ΔC) reverts apoptosis-resistant hFis1 RNAi cells. HeLa cells were transfected with control shRNA/pREP4 (a), hFis1 shRNA/pREP4 (b), hFis1 shRNA/pREP4 plus hFis1wt cDNA/pcDNA3.1 (c), or hFis1 shRNA/pREP4 plus hFis1ΔC cDNA/pcDNA3.1 (d), and transfectants were selected as described in Materials and Methods. (A) Transfectants of each group (a–d) were treated with or without STS (1 μM) for 6 h, lysed, and analyzed for hFis1 expression levels and PARP cleavage by Western blotting. Actin also was analyzed as a loading control. (B) Transfectants of each group (a–d) were treated with STS (1 μM; 6 h), and the nuclei were stained with Hoechst 33342 (1 μg/ml; 15 min at RT). Normal or apoptotic nuclei of these cells in several fields were counted under the fluorescent microscope (for UV excitation). At least 200 cells altogether in each treatment were counted and shown as a percentage of cells with apoptotic nuclei among the total cells counted. The data are plotted as the mean ± SD of at least three independent experiments. (C) Transfectants of each group (a–d) were treated with Act D (10 μM; 8 h) in the presence of zVAD-fmk (50 μM), fixed, and stained with anti-cytochrome c (mouse monoclonal, green) antibodies, and images were captured by confocal microscopy. (D) The number of cells whose cytochrome c was released was counted and plotted as a percentage of the total cells counted in each group (a–d) of transfectants that had been treated with Act D and stained with anti-cytochrome c (the same samples as shown in C). At least 200 cells were counted altogether in several fields. Data are plotted as the mean ± SD of at least three independent experiments.
Figure 6.
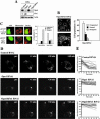
Depletion of Opa1 induces mitochondrial fragmentation, and cells become very sensitive to apoptosis. HeLa cells were transfected with pREP4 constructs containing shRNA of the target sequence of Opa1 or control, and the transfectants were selected by growing in media containing hygromycin B. (A) total cell lysates from the Opa1 RNAi cells along with control RNAi cells were prepared and the expression level of Opa1 was analyzed by Western blotting. Actin level also was analyzed as a loading control. (B) Mitochondria of control RNAi cells and Opa1 RNAi cells were visualized with Mitotracker Red CMXRos and analyzed by confocal microscopy. Enlargements are shown for detailed structure of mitochondria. (C) Percentage of cell population with fragmented (dotted), normal (solid), or elongated (striped) mitochondria in control RNAi or Opa1 RNAi culture. At least 200 cells in several fields were counted in each experiment. Data represent the mean ± SD of at least three independent experiments. (D) Opa1-depleted cells along with control RNAi cells were treated with STS (1 μM; 6 h), Act D (10 μM; 8 h), etoposide (100 μM; 30 h), or anti-Fas antibody (500 ng/ml; 15 h), and apoptotic nuclei (stained with Hoechst) were scored and plotted as a percentage of total cells (at least 200 cells) counted. Data are shown as the mean ± SD of three independent experiments. (E) Total DNA was isolated from the cells treated as described above and analyzed by agarose gel electrophoresis and visualized with ethidium bromide. The first lane is a DNA ladder control. The figure shown is a representative of three independent experiments. (F) HeLa cells depleted of Opa1 along with control RNAi cells were incubated with or without Act D (10 μM) for 8 h in the presence of zVAD-fmk, fixed, and stained with anti-Bax (red; our unpublished data) and anti-cytochrome c antibodies (green). (G) The number of cells in F displaying Bax translocation or cytochrome c release was counted and plotted as a percentage of total cells counted in each RNAi cell population that had been treated with or without Act D and stained with anti-Bax and anti-cytochrome c antibodies (the same samples as shown in F). At least 200 cells were counted altogether in several fields. Data are plotted as the mean ± SD of at least three independent experiments. (H) PARP cleavage was analyzed in the total extracts from HeLa cells depleted of Opa1 and control that were treated with STS (1 μM; 0, 3, 6 h), Act D (10 μM; 0, 4, 8 h), or anti-Fas (500 ng/ml; 0, 6, 15 h). The figure is a representative of at least three independent experiments.
Figure 7.
Mitochondria are extensively fragmented in the cells depleted of both hFis1 and Opa1. HeLa cells were transfected with pREP4 constructs containing shRNA of the target sequence of hFis1, Opa1, or both of them together along with control, and the transfectants were selected by growing in media containing hygromycin B. (A) Total cell lysates from the hFis1 RNAi cells, Opa1 RNAi cells, or both hFis1 and Opa1 RNAi cells along with control RNAi cells were prepared, and the expression levels of hFis1 and Opa1 were analyzed by Western blotting. Actin also was analyzed as a loading control. (B) Left, mitochondria of hFis1/Opa1 RNAi cells were visualized with Mitotracker Red CMXRos and analyzed by confocal microscopy. An enlargement is shown for detailed structure of mitochondria. Right, percentage of cell population with fragmented (dotted), normal (solid), or elongated (striped) mitochondria in hFis1/Opa1 RNAi cell culture. At least 200 cells in several fields were counted in each experiment. Data represent the mean ± SD of at least three independent experiments. (C) The elongated mitochondrial morphology in hFis1-depleted cells was reversed by subsequent depletion of Opa1. Hela cells depleted of hFis1 by RNAi were selected for 5 d and transfected again with Opa1 shRNA- or a control shRNA-construct and examined 2 d later. To identify transfectants, pEYFP vector was cotransfected. Mitochondria were visualized with Mitotracker Red CMXRos and analyzed by confocal microscopy. (D and E) Control RNAi, Opa1 RNAi, and hFis1/Opa1 RNAi double RNAi cells were analyzed for mitochondrial fusion by using mito-PAGF–based fusion assay. Cells were transfected with mito-PAGFP, followed by the photoactivation of the small regions within the cells (white circles in prepanels) and confocal acquisition of z-series covering the entire thickness of the cell. (E) Changes in the fluorescence intensity within activated regions were measured over time.
Figure 8.
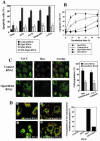
Cells depleted of both hFis1 and Opa1 show apoptosis resistance like hFis1-depleted cells. (A) HeLa cells depleted of hFis1, Opa1, or both of them by RNAi along with control RNAi cells were treated with STS (1 μM; 6 h), Act D (10 μM; 8 h), etoposide (100 μM; 30 h), or anti-Fas antibody (500 ng/ml; 15 h), and the nuclei were stained with Hoechst 33342 (1 μg/ml; 15 min at RT). Normal or apoptotic nuclei of these cells in several fields were counted under the fluorescent microscope (for UV excitation). At least 200 cells altogether in each treatment were counted and plotted as a percentage of cells with apoptotic nuclei among the total cells counted. The data are shown as the mean ± SD of at least three independent experiments. (B) HeLa cells depleted of Opa1, hFis1, or both of them along with control RNAi cells were incubated with anti-Fas antibody (500 ng/ml) for the periods as indicated, and the nuclei were stained and counted as normal or apoptotic nuclei. At least 200 cells altogether were counted in each sample at each time point and plotted as a percentage of cells with apoptotic nuclei among the total cells counted. The data were plotted as the mean ± SD of at least three independent experiments. (C) Bax translocation and cytochrome c release induced by Act D treatment are inhibited in hFis/Opa1 RNAi cells. Left, HeLa cells depleted of both hFis1 and Opa1 by RNAi along with control RNAi cells were treated with Act D (10 μM; 8 h) in the presence of zVAD-fmk (50 μM), fixed, and double stained with anti-Bax (rabbit polyclonal, red) and anti-cytochrome c (mouse monoclonal, green) antibodies. Right, the number of cells displaying Bax translocation or cytochrome c release was counted and plotted as a percentage of the total cells counted in each RNAi cell population that had been treated with Act D and stained with anti-Bax and anti-cytochrome c antibodies (the same samples as shown on the left). At least 200 cells were counted altogether in several fields. Data are plotted as the mean ± SD of at least three independent experiments. (D) hFis1 depletion prevents mitochondrial membrane potential reduction induced by Opa1 depletion. Left, HeLa cells depleted of hFis1 (b), Opa1 (c), or both of them (d) along with control RNAi cells (a) were incubated with 5 μg/ml JC-1 for 20 min and observed by confocal microscopy. JC-1 is a cationic dye that indicates mitochondrial polarization by shifting its fluorescence emission from green to red. Regions of high mitochondrial membrane potential are indicated by red fluorescence, and regions of low mitochondrial membrane potential are indicated by green fluorescence. Right, the number of cells with mitochondria whose membrane potential was lost was counted and plotted as a percentage of the total cells counted in each RNAi cell population.
Similar articles
- Mitochondrial fission and fusion mediators, hFis1 and OPA1, modulate cellular senescence.
Lee S, Jeong SY, Lim WC, Kim S, Park YY, Sun X, Youle RJ, Cho H. Lee S, et al. J Biol Chem. 2007 Aug 3;282(31):22977-83. doi: 10.1074/jbc.M700679200. Epub 2007 Jun 1. J Biol Chem. 2007. PMID: 17545159 - Inhibiting Drp1-mediated mitochondrial fission selectively prevents the release of cytochrome c during apoptosis.
Estaquier J, Arnoult D. Estaquier J, et al. Cell Death Differ. 2007 Jun;14(6):1086-94. doi: 10.1038/sj.cdd.4402107. Epub 2007 Mar 2. Cell Death Differ. 2007. PMID: 17332775 - Human Fis1 regulates mitochondrial dynamics through inhibition of the fusion machinery.
Yu R, Jin SB, Lendahl U, Nistér M, Zhao J. Yu R, et al. EMBO J. 2019 Apr 15;38(8):e99748. doi: 10.15252/embj.201899748. Epub 2019 Mar 6. EMBO J. 2019. PMID: 30842096 Free PMC article. - [Mechanism of mitochondrial fission - structure and function of Drp1 protein].
Michalska B, Duszyński J, Szymański J. Michalska B, et al. Postepy Biochem. 2016;62(2):127-137. Postepy Biochem. 2016. PMID: 28132464 Review. Polish. - Dynamin-related protein 1 and mitochondrial fragmentation in neurodegenerative diseases.
Reddy PH, Reddy TP, Manczak M, Calkins MJ, Shirendeb U, Mao P. Reddy PH, et al. Brain Res Rev. 2011 Jun 24;67(1-2):103-18. doi: 10.1016/j.brainresrev.2010.11.004. Epub 2010 Dec 8. Brain Res Rev. 2011. PMID: 21145355 Free PMC article. Review.
Cited by
- Mitochondrial fission determines cisplatin sensitivity in tongue squamous cell carcinoma through the BRCA1-miR-593-5p-MFF axis.
Fan S, Liu B, Sun L, Lv XB, Lin Z, Chen W, Chen W, Tang Q, Wang Y, Su Y, Jin S, Zhang D, Zhong J, Li Y, Wen B, Zhang Z, Yang P, Zhou B, Liang Q, Yu X, Zhu Y, Hu P, Chu J, Huang W, Feng Y, Peng H, Huang Q, Song E, Li J. Fan S, et al. Oncotarget. 2015 Jun 20;6(17):14885-904. doi: 10.18632/oncotarget.3659. Oncotarget. 2015. PMID: 25912308 Free PMC article. - Piceatannol enhances cisplatin sensitivity in ovarian cancer via modulation of p53, X-linked inhibitor of apoptosis protein (XIAP), and mitochondrial fission.
Farrand L, Byun S, Kim JY, Im-Aram A, Lee J, Lim S, Lee KW, Suh JY, Lee HJ, Tsang BK. Farrand L, et al. J Biol Chem. 2013 Aug 16;288(33):23740-50. doi: 10.1074/jbc.M113.487686. Epub 2013 Jul 5. J Biol Chem. 2013. PMID: 23833193 Free PMC article. - Mitochondrial dynamics: regulatory mechanisms and emerging role in renal pathophysiology.
Zhan M, Brooks C, Liu F, Sun L, Dong Z. Zhan M, et al. Kidney Int. 2013 Apr;83(4):568-81. doi: 10.1038/ki.2012.441. Epub 2013 Jan 16. Kidney Int. 2013. PMID: 23325082 Free PMC article. Review. - MICOS assembly controls mitochondrial inner membrane remodeling and crista junction redistribution to mediate cristae formation.
Stephan T, Brüser C, Deckers M, Steyer AM, Balzarotti F, Barbot M, Behr TS, Heim G, Hübner W, Ilgen P, Lange F, Pacheu-Grau D, Pape JK, Stoldt S, Huser T, Hell SW, Möbius W, Rehling P, Riedel D, Jakobs S. Stephan T, et al. EMBO J. 2020 Jul 15;39(14):e104105. doi: 10.15252/embj.2019104105. Epub 2020 Jun 22. EMBO J. 2020. PMID: 32567732 Free PMC article. - Aqueous Extract of Paris polyphylla (AEPP) Inhibits Ovarian Cancer via Suppression of Peroxisome Proliferator-Activated Receptor-Gamma Coactivator (PGC)-1alpha.
Wang CW, Tai CJ, Choong CY, Lin YC, Lee BH, Shi YC, Tai CJ. Wang CW, et al. Molecules. 2016 Jun 3;21(6):727. doi: 10.3390/molecules21060727. Molecules. 2016. PMID: 27271583 Free PMC article.
References
- Alexander, C., et al. (2000). OPA1, encoding a dynamin-related GTPase, is mutated in autosomal dominant optic atrophy linked to chromosome 3q28. Nat. Genet. 26, 211-215. - PubMed
- Bereiter-Hahn, J. (1990). Behavior of mitochondria in the living cell. Int. Rev. Cytol. 122, 1-63. - PubMed
- Blatch, G.L., and Lassle, M. (1999). The tetratricopeptide repeat: a structural motif mediating protein-protein interactions. Bioessays 21, 932-939. - PubMed
Publication types
MeSH terms
Substances
LinkOut - more resources
Full Text Sources
Other Literature Sources
Miscellaneous
