A balance between excitatory and inhibitory synapses is controlled by PSD-95 and neuroligin - PubMed (original) (raw)
A balance between excitatory and inhibitory synapses is controlled by PSD-95 and neuroligin
Oliver Prange et al. Proc Natl Acad Sci U S A. 2004.
Abstract
Factors that control differentiation of presynaptic and postsynaptic elements into excitatory or inhibitory synapses are poorly defined. Here we show that the postsynaptic density (PSD) proteins PSD-95 and neuroligin-1 (NLG) are critical for dictating the ratio of excitatory-to-inhibitory synaptic contacts. Exogenous NLG increased both excitatory and inhibitory presynaptic contacts and the frequency of miniature excitatory and inhibitory synaptic currents. In contrast, PSD-95 overexpression enhanced excitatory synapse size and miniature frequency, but reduced the number of inhibitory synaptic contacts. Introduction of PSD-95 with NLG augmented synaptic clustering of NLG and abolished NLG effects on inhibitory synapses. Interfering with endogenous PSD-95 expression alone was sufficient to reduce the ratio of excitatory-to-inhibitory synapses. These findings elucidate a mechanism by which the amounts of specific elements critical for synapse formation control the ratio of excitatory-to-inhibitory synaptic input.
Figures
Fig. 1.
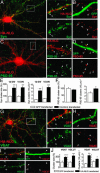
NLG induces excitatory and inhibitory presynaptic contact formation. Hippocampal neurons were transfected with HA-tagged NLG (HA-NLG) or GFP and stained for synaptophysin (Syn), PSD-95, VGAT, or VGLUT. (A) Size and number of Syn-positive terminals (white arrowheads; n = 10 and 11 cells) were enhanced on dendrites from neurons expressing HA-NLG when compared with GFP-expressing cells (B)(n = 12 and 9 cells). (C and D) A modest increase in the number of PSD-95 puncta was observed. (E) Similar changes in Syn cluster size and number were seen at both DIV 12 and 15. (F) Summary of changes in PSD-95 cluster number and size in cells expressing HA-NLG. (G_–_I) Size and number of VGAT-positive (n = 11 cells) and VGLUT-positive (n = 8 cells) contacts (white arrowheads) increased on dendrites from HA-NLG-expressing cells when compared with GFP-expressing cells (n = 12 cells, 242 terminals). (J) Summary of changes in VGAT and VGLUT cluster size and number in HA-NLG-expressing cells. In A_–_D and G_–_I, black arrowheads depict synaptic puncta from neighboring untransfected cells. *, P < 0.05; ***, P < 0.001 (Mann–Whitney U test). (Scale bars: 10 μm, A, C, and G; 1 μm, A Inset, B Inset, D, H, and I.)
Fig. 2.
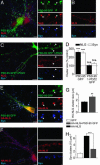
PSD-95 regulates NLG clustering and presynaptic maturation. Hippocampal neurons were transfected with either PSD-95 GFP or a mutant form of PSD-95 containing PDZ domains 1 and 2 (PSD-95 GFP 1-PDZ2). (A_–_C) Cells were stained with antibodies specific to NLG1 and NLG3 and the presynaptic marker synaptophysin (Syn). Dendritic clusters of endogenous NLG were compared between cells expressing PSD-95 GFP (A) (white arrowheads; n = 11 cells) and neighboring untransfected cells (B) or cells expressing PSD-95 GFP 1-PDZ2 (C). (D) Summary of changes of NLG and Syn in these neurons. PSD-95 GFP expression increased NLG and Syn cluster size. No significant change (n.s.) in NLG and Syn cluster size was observed in neurons expressing PSD-95 GFP 1-PDZ2. (E_–_H) Expression of PSD-95 GFP with HA-NLG enhanced the size of NLG clusters but reduced Syn-positive contact number when compared with neurons expressing HA-NLG alone. (E and F Right) Higher magnification micrographs of boxed regions overview images are shown. **, P < 0.01; ***, P < 0.001 (Mann–Whitney U test). (Scale bars: 10 μm, A Left, C Left, E Left, and F Left; 1 μm, A Right, B, C Right, E Right, and F Right.)
Fig. 3.
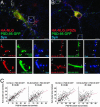
PSD-95 restricts NLG localization to excitatory synapses. Cells transfected with HA-NLG and PSD-95 GFP and stained with VGAT or VGLUT. (A Right) Magnifications of Inset Left.(A and B) PSD-95 GFP recruited HA-NLG to sites positive for VGLUT (n = 7 cells) but not VGAT (n = 10 cells). (C) Graph summarizing these results. (D and E) GluR1 cluster size was enhanced in dendrites from cells expressing PSD-95 GFP alone (n = 9 cells) or HA-NLG (n = 8 cells; white arrowheads) when compared with GluR1 clusters from untransfected controls (n = 10 cells). Expression of HA-NLG alone (n = 8 cells) did not enhance GluR1 clustering. **, P < 0.01; ***, P < 0.001 (Mann–Whitney U test). (Scale bars: 10 μm, A Left; 1 μm, A Right, B, and D.)
Fig. 4.
PDZ-dependent interactions regulate the morphology of synapses induced by PSD-95 and NLG. (A and B) Neurons were transfected with PSD-95 GFP and either WT HA-NLG or a mutant HA-NLG lacking the PDZ-binding site (HA-NLGΔPDZb) and immunostained as indicated. (A) Colocalization (white arrowheads) of HA-NLG with PSD-95 GFP and apposed synaptophysin (Syn)-labeled presynaptic terminals. (A1 and A2) Localization of HA-NLG clusters and apposed presynaptic terminal to PSD-95 GFP. (B) HA-NLGΔPDZb is not recruited to PSD-95 GFP clusters (white arrowheads). (C) The correlation between the size of PSD-95 GFP, HA-NLG, and Syn clusters at single synaptic sites (linear fit; red line) was stronger in cells coexpressing PSD-95 GFP and WT HA-NLG (P < 0.0001; n = 10 cells, 219 clusters) when compared to cells expressing PSD-95 GFP and HA-NLGΔPDZb (P < 0.001; n = 10 cells, 225 clusters). (Scale bars: 10 μm, A and B;1 μm, A1, A2, B1, and B2.)
Fig. 5.
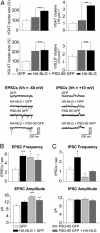
Manipulation of NLG and PSD-95 expression alters the ratio of excitatory to inhibitory synaptic contacts. (A Upper) The number and size of VGAT-labeled contacts significantly decreased in cells coexpressing HA-NLG and PSD-95 GFP (n = 10 cells, 701 terminals) compared with cells expressing HA-NLG alone (n = 11 cells, 2,145 terminals). (A Lower) No change in number and size of VGLUT-labeled excitatory presynaptic contacts in cells coexpressing HA-NLG and PSD-95 GFP (n = 7 cells, 572 terminals) compared with cells expressing HA-NLG alone (n = 8 cells, 705 terminals). (B and C) Electrophysiological recordings from hippocampal neurons transfected with HA-NLG and GFP (to visualize cells) (n = 26), PSD-95 GFP (n = 8), HA-NLG and PSD-95 GFP (n = 9), or GFP alone (controls, n = 16). Spontaneous mEPSCs (B) and mIPSCs (C) were measured at holding potentials of –60 mV and +10mV, respectively. (B) Enhanced mEPSC frequency and amplitude in cells expressing PSD-95 GFP and HA-NLG with PSD-95 GFP. Enhancement of mEPSC frequency, but not of amplitude, in cells expressing HA-NLG with GFP is shown. (C) mIPSC frequency was enhanced in cells expressing HA-NLG with GFP, reduced in cells expressing PSD-95 GFP, and unchanged in cells expressing HA-NLG with PSD-95 GFP. No difference in the average mIPSC amplitude between cell groups was found. *, P < 0.05; **, P < 0.01; ***, P < 0.001 (Mann–Whitney U test).
Fig. 6.
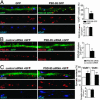
Altered expression of PSD-95 influences the ratio of excitatory-to-inhibitory presynaptic contacts. (A) Hippocampal cells were transfected with either GFP (controls, Left) or PSD-95 GFP (Center) and immunostained at DIV 12 for GFP, synaptophysin (Syn), and the GABA inhibitory presynaptic marker VGAT. PSD-95 GFP expression resulted in a significant decrease in the percentage of VGAT-positive inhibitory contacts (Upper Right) but did not alter the number of PSD-95 clusters (Lower Right) (n = 15 cells, 288 VGAT+, 778 VGAT–) compared with controls (n = 12 cells, 242 VGAT+, 272 VGAT–). (B and C) Introduction of GFP with either a scrambled siRNA (control siRNA; Left) or PSD-95 siRNA (Center). (B Right) A reduction in the number of PSD-95-positive puncta in cells cotransfected with GFP and PSD-95 siRNA (n = 11 cells, 301 puncta) compared with controls (n = 7 cells, 406 puncta) was found. (C Right) A significant increase in the percentage of inhibitory contacts (VGAT+) and a concurrent decrease in the percentage of excitatory contacts (VGAT–)(Upper) was found, but there was no change in the total number of synapses in cells expressing GFP and PSD-95 siRNA (n = 11 cells, 322 VGAT+, 282 VGAT–) compared with controls (n = 12 cells, 230 VGAT+, 494 VGAT–)(Lower). **, P < 0.01; ***, P < 0.001 (Mann–Whitney U test). (Scale bars: = 1 μm.)
Similar articles
- Neuroligins mediate excitatory and inhibitory synapse formation: involvement of PSD-95 and neurexin-1beta in neuroligin-induced synaptic specificity.
Levinson JN, Chéry N, Huang K, Wong TP, Gerrow K, Kang R, Prange O, Wang YT, El-Husseini A. Levinson JN, et al. J Biol Chem. 2005 Apr 29;280(17):17312-9. doi: 10.1074/jbc.M413812200. Epub 2005 Feb 21. J Biol Chem. 2005. PMID: 15723836 - Neuroligin 1 is a postsynaptic cell-adhesion molecule of excitatory synapses.
Song JY, Ichtchenko K, Südhof TC, Brose N. Song JY, et al. Proc Natl Acad Sci U S A. 1999 Feb 2;96(3):1100-5. doi: 10.1073/pnas.96.3.1100. Proc Natl Acad Sci U S A. 1999. PMID: 9927700 Free PMC article. - NGL family PSD-95-interacting adhesion molecules regulate excitatory synapse formation.
Kim S, Burette A, Chung HS, Kwon SK, Woo J, Lee HW, Kim K, Kim H, Weinberg RJ, Kim E. Kim S, et al. Nat Neurosci. 2006 Oct;9(10):1294-301. doi: 10.1038/nn1763. Epub 2006 Sep 17. Nat Neurosci. 2006. PMID: 16980967 - New players tip the scales in the balance between excitatory and inhibitory synapses.
Levinson JN, El-Husseini A. Levinson JN, et al. Mol Pain. 2005 Mar 23;1:12. doi: 10.1186/1744-8069-1-12. Mol Pain. 2005. PMID: 15813960 Free PMC article. Review. - Wnt-5a is a synaptogenic factor with neuroprotective properties against Aβ toxicity.
Varela-Nallar L, Parodi J, Farías GG, Inestrosa NC. Varela-Nallar L, et al. Neurodegener Dis. 2012;10(1-4):23-6. doi: 10.1159/000333360. Epub 2012 Jan 17. Neurodegener Dis. 2012. PMID: 22261402 Review.
Cited by
- In vivo clonal overexpression of neuroligin 3 and neuroligin 2 in neurons of the rat cerebral cortex: Differential effects on GABAergic synapses and neuronal migration.
Fekete CD, Chiou TT, Miralles CP, Harris RS, Fiondella CG, Loturco JJ, De Blas AL. Fekete CD, et al. J Comp Neurol. 2015 Jun 15;523(9):1359-78. doi: 10.1002/cne.23740. Epub 2015 Apr 8. J Comp Neurol. 2015. PMID: 25565602 Free PMC article. - The Adhesion-GPCR BAI1 Promotes Excitatory Synaptogenesis by Coordinating Bidirectional Trans-synaptic Signaling.
Tu YK, Duman JG, Tolias KF. Tu YK, et al. J Neurosci. 2018 Sep 26;38(39):8388-8406. doi: 10.1523/JNEUROSCI.3461-17.2018. Epub 2018 Aug 17. J Neurosci. 2018. PMID: 30120207 Free PMC article. - In vivo induction of postsynaptic molecular assembly by the cell adhesion molecule Fasciclin2.
Kohsaka H, Takasu E, Nose A. Kohsaka H, et al. J Cell Biol. 2007 Dec 17;179(6):1289-300. doi: 10.1083/jcb.200705154. Epub 2007 Dec 10. J Cell Biol. 2007. PMID: 18070911 Free PMC article. - Pyk2 in the amygdala modulates chronic stress sequelae via PSD-95-related micro-structural changes.
Montalban E, Al-Massadi O, Sancho-Balsells A, Brito V, de Pins B, Alberch J, Ginés S, Girault JA, Giralt A. Montalban E, et al. Transl Psychiatry. 2019 Jan 15;9(1):3. doi: 10.1038/s41398-018-0352-y. Transl Psychiatry. 2019. PMID: 30664624 Free PMC article. - Polarized targeting of neurexins to synapses is regulated by their C-terminal sequences.
Fairless R, Masius H, Rohlmann A, Heupel K, Ahmad M, Reissner C, Dresbach T, Missler M. Fairless R, et al. J Neurosci. 2008 Nov 26;28(48):12969-81. doi: 10.1523/JNEUROSCI.5294-07.2008. J Neurosci. 2008. PMID: 19036990 Free PMC article.
References
- Zhai, R. G., Vardinon-Friedman, H., Cases-Langhoff, C., Becker, B., Gundelfinger, E. D., Ziv, N. E. & Garner, C. C. (2001) Neuron 29, 131–143. - PubMed
- Brose, N. (1999) Naturwissenschaften 86, 516–524. - PubMed
- Ziv, N. E. (2001) Neuroscientist 7, 365–370. - PubMed
- Shapira, M., Zhai, R. G., Dresbach, T., Bresler, T., Torres, V. I., Gundelfinger, E. D., Ziv, N. E. & Garner, C. C. (2003) Neuron 38, 237–252. - PubMed
- Lee, S. H. & Sheng, M. (2000) Curr. Opin. Neurobiol. 10, 125–131. - PubMed
Publication types
MeSH terms
Substances
LinkOut - more resources
Full Text Sources
Other Literature Sources
Molecular Biology Databases
