Characterization of the survival motor neuron (SMN) promoter provides evidence for complex combinatorial regulation in undifferentiated and differentiated P19 cells - PubMed (original) (raw)
Characterization of the survival motor neuron (SMN) promoter provides evidence for complex combinatorial regulation in undifferentiated and differentiated P19 cells
Raphaël Rouget et al. Biochem J. 2005.
Abstract
There exist two SMN (survival motor neuron) genes in humans, the result of a 500 kb duplication in chromosome 5q13. Deletions/mutations in the SMN1 gene are responsible for childhood spinal muscular atrophy, an autosomal recessive neurodegenerative disorder. While the SMN1 and SMN2 genes are not functionally equivalent, up-regulation of the SMN2 gene represents an important therapeutic target. Consequently, we exploited in silico, in vitro and in vivo approaches to characterize the core human and mouse promoters in undifferentiated and differentiated P19 cells. Phylogenetic comparison revealed four highly conserved regions that contained a number of cis-elements, only some of which were shown to activate/repress SMN promoter activity. Interestingly, the effect of two Sp1 cis-elements varied depending on the state of P19 cells and was only observed in combination with a neighbouring Ets cis-element. Electrophoretic mobility-shift assay and in vivo DNA footprinting provided evidence for DNA-protein interactions involving Sp, NF-IL6 and Ets cis-elements, whereas transient transfection experiments revealed complex interactions involving these recognition sites. SMN promoter activity was strongly regulated by an NF-IL6 response element and this regulation was potentiated by a downstream Ets element. In vivo results suggested that the NF-IL6 response must function either via a protein-tethered transactivation mechanism or a transcription factor binding an upstream element. Our results provide strong evidence for complex combinatorial regulation and suggest that the composition or state of the basal transcription complex binding to the SMN promoter is different between undifferentiated and differentiated P19 cells.
Figures
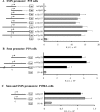
Figure 1. Characterization of the proximal SMN promoter
A number of human SMN (A) and mouse Smn (B) promoter fragments were cloned upstream of the luciferase reporter gene. The names of different constructs are provided to the left of the bar graph and refer to the 5′ (m for minus) and 3′ (p for plus) nucleotide positions with respect to the +1 TIS (arrow). The vectors are depicted as solid lines, whereas dotted lines correspond to deleted segments. The human SMN-Luc (A) and mouse Smn-Luc (B) vectors were transiently transfected into undifferentiated (P19) and differentiated (P19RA) cells (C). The bar graph (grey for human, black for mouse and striped for simplex virus 40 constructs) depicts promoter activities (x-axis), expressed as RLU ×106 normalized against β-galactosidase activity as a measure of transfection efficiency. A Mann–Whitney U test was used to compare the promoter activities of deletion and m107p156 (human) or m105p125 (mouse) constructs; asterisks identify those with statistically significant differences (α≤0.05).
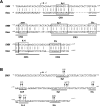
Figure 2. Phylogenetic footprinting
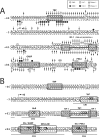
(A) Alignment of the proximal human (SMN) and mouse (Smn) promoters; regions of conserved sequence identity are underlined (CR1–CR4). Vertical bars and boxes annotate sequence identity and putative _cis_-elements respectively. The IL-6 site corresponds to the NF-IL6 response element. (B) The human proximal promoter sequence and the mutations introduced by site-directed mutagenesis are shown above the putative Sp1, AhR, Ets and IL-6 _cis_-elements. The arrow ↱ corresponds to the +1 TIS.
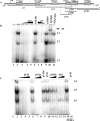
Figure 3. EMSA analysis of the human SMN core promoter
(A) Schematic representation of the proximal human SMN promoter (nt −15 to +117) and the putative _cis_-elements under investigation. Indicated below are the double-strand DNA probes used for EMSA studies, pV, pVI and pVII as well as competitor probes pVIc, pVIIa and pVIIb. The asterisk marks the extremity that was end-labelled with [γ-32P]dCTP. (B) EMSA analysis using end-labelled pV probe (lane 1) incubated with nuclear extract prepared from P19 (lanes 2–5, 7, 8, 10 and 11), P19RA (lane 6) or EHMN (lane 9) cells. A double-strand, unlabelled competitor oligonucleotide corresponding to the consensus Sp1 sequence was added in 10, 50 or 200 times excess in lanes 3–5. Double-strand pV competitor was added in 100 or 50 times excess in lanes 7 and 8 respectively. Binding reactions in the presence of 2 μl of anti-Sp1 or anti-MAZ antibody were run in lanes 10 and 11 respectively. The three DNA–protein complexes are designated as C1, C2 and C3 as shown to the right of the gel. A single supershift (SS) complex was observed in lane 10 as indicated by the arrow. (C) EMSA analysis using end-labelled pVII probe (lane 1) incubated with 4 μg of nuclear extract prepared from P19 (lanes 2–14) or P19RA (lanes 15 and 16). Lanes 2, 6 and 15 do not contain competitor probes. Double-strand, unlabelled competitor probes designated at the top of the gel were added in 10× (lane 3), 50× (lanes 4, 7, 11 and 13) or 200× excess (lanes 5, 8–10, 12, 14 and 16). The three DNA–protein complexes are designated as C4, C5 and C6 as shown to the right of the gel. The bottom of the gel was removed (B, C) so that the band corresponding to free probe is not shown. EMSAs were repeated at least three times.
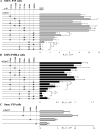
Figure 4. Transient transfection assays of wild-type and mutant prSMN-pGL3 constructs
Mutations in the +11Sp1, +37AhR, +56Sp1, +79Ets, +86IL-6 and +105Ets were created singly or in combination as shown schematically to the left of the bar graphs. The × indicates the presence of a given mutation within the constructs shown along the _Y_-axis. SMN promoter activity is expressed as RLU×106 normalized against β-galactosidase activity as a measure of transfection efficiency (_X_-axis). Each construct was transiently transfected into undifferentiated (A) and differentiated (B) P19 cells. Note the different scale in (A, B) underscoring the lower SMN promoter activity in differentiated P19 cells. (C) The wild-type (m46p125) and mutant (+70Sp1, +97IL-6 and +115Ets _cis_-elements) mouse Smn promoter constructs schematically shown to the left of the bar graphs were transiently transfected into undifferentiated P19 cells. Asterisks identify those constructs that displayed SMN (A, B) or Smn promoter (C) activity significantly different from the corresponding wild-type minimal proximal SMN/Smn promoter constructs (m15p117 for A and B; or m46p125 for C) as determined using the Mann–Whitney U test. Asterisks identify statistically significant differences between mutant constructs (_P_≤0.05).
Figure 5. In vivo DNA footprint of the mouse Smn proximal promoter spanning nt −46 to +125
(A) The region shown was analysed with primer set Smn6 to reveal upper strand sequences from nt −46 to +12 relative to the +1 TIS. Lanes 1–4, LMPCR of DNA purified from undifferentiated (U) (lanes 1 and 2) and differentiated (D) (lanes 3 and 4) P19 cells, treated with DMS in vitro (t) (lanes 1 and 3) after DNA purification or in vivo (v) (lanes 2 and 4) before DNA purification. Lanes 5–8, Maxam–Gilbert sequencing reactions. Lanes 9–12, LMPCR of DNA purified from differentiated (D) (lanes 9 and 10) and undifferentiated (U) (lanes 11 and 12) P19 cells, irradiated with UVC in vivo (v) (lanes 9 and 11) before DNA purification or in vitro (t) (lanes 10 and 12) after DNA purification. Lanes 13–16, LMPCR of DNA purified from differentiated (D) (lanes 13 and 14) and undifferentiated (U) (lanes 15 and 16) P19 cells, treated with DNase I in vivo (v) (lanes 13 and 15) before DNA purification or in vitro (t) (lanes 14 and 16) after DNA purification. (B) The region shown was analysed with primer set Smn2 to reveal upper strand sequences from nt −13 to +90 relative to the +1 TIS. Lanes 1–16 and footprint characteristics for DMS, UVC and DNase I are as described in (A). Overlapping sequences detected with primer sets Smn6 and Smn4 are annotated to the left of the Figure. (C) The region shown was analysed with primer set Smn5 to reveal bottom strand sequences from nt +125 to +90 relative to the +1 TIS. Lanes 1–16 and footprint characteristics for DMS, UVC and DNase I are as described in (A). DMS protection and hyperreactivity is indicated by ○ and ● respectively (displayed on the left). UVC protection and hyperactivity is indicated by □ and ■ respectively (displayed on the right). DNase I protection and hyperactivity is indicated by ‘−’ and ‘+’ signs respectively (displayed on the right). As a reference, the corresponding portion of the Maxam–Gilbert-derived sequence is shown on both sides of the autoradiogram. Arrows indicate footprinted bands. Regions covered by superposing primer sets are indicated at the far left of the autoradiogram. The sequence overlapping with primer set Smn2 is annotated to the left of the Figure.
Figure 6. Summary of in vivo DMS, UVC and DNase I footprints of the mouse Smn proximal promoter
(A) Nucleotides protected from DMS (○), UVC (□) or DNase I (↓) modification and DMS (●), UVC (■) or DNase I (↑) hypersensitive sites are indicated. The +1 TIS is annotated with an arrow ↱. (B) Regions of protected DNA corresponding to known _cis_-elements are highlighted by grey boxes. The putative TFs are annotated above their respective _cis_-elements. Regions of conserved sequence identity between the human and mouse promoters (CR1 to CR4) are underlined. The nucleotides targeted for site-directed mutagenesis are shown in boldface.
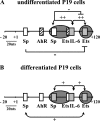
Figure 7. Summary of in silico, in vitro and in vivo analyses of transcriptional activation of the SMN proximal promoter in undifferentiated (A) and differentiated (B) P19 cells
Schematic representation of the −20 to +120 bp region of the SMN promoter region summarizing the role of putative Sp, AhR, Ets and IL-6 _cis_-elements in regulating SMN expression. _Cis_-elements that had no effect (open boxes), activate (grey boxes) or repress (striped boxes) SMN promoter activity are shown and the results of single-site mutagenesis is summarized. Combinatorial effects are shown above and below the promoter region with the ‘+’ and ‘−’ signs designating synergistic and antagonistic effects respectively. Regions protected from DMS, UV or DNase I treatment in vivo are shown by the presence of dark grey circles depicting regions of DNA–protein interactions.
Similar articles
- Therapeutics development for spinal muscular atrophy.
Sumner CJ. Sumner CJ. NeuroRx. 2006 Apr;3(2):235-45. doi: 10.1016/j.nurx.2006.01.010. NeuroRx. 2006. PMID: 16554261 Free PMC article. Review. - The SMN genes are subject to transcriptional regulation during cellular differentiation.
Germain-Desprez D, Brun T, Rochette C, Semionov A, Rouget R, Simard LR. Germain-Desprez D, et al. Gene. 2001 Nov 28;279(2):109-17. doi: 10.1016/s0378-1119(01)00758-2. Gene. 2001. PMID: 11733135 - Identification of a novel cyclic AMP-response element (CRE-II) and the role of CREB-1 in the cAMP-induced expression of the survival motor neuron (SMN) gene.
Majumder S, Varadharaj S, Ghoshal K, Monani U, Burghes AH, Jacob ST. Majumder S, et al. J Biol Chem. 2004 Apr 9;279(15):14803-11. doi: 10.1074/jbc.M308225200. Epub 2004 Jan 23. J Biol Chem. 2004. PMID: 14742439 Free PMC article. Retracted. - Synthesis and biological evaluation of novel 2,4-diaminoquinazoline derivatives as SMN2 promoter activators for the potential treatment of spinal muscular atrophy.
Thurmond J, Butchbach ME, Palomo M, Pease B, Rao M, Bedell L, Keyvan M, Pai G, Mishra R, Haraldsson M, Andresson T, Bragason G, Thosteinsdottir M, Bjornsson JM, Coovert DD, Burghes AH, Gurney ME, Singh J. Thurmond J, et al. J Med Chem. 2008 Feb 14;51(3):449-69. doi: 10.1021/jm061475p. Epub 2008 Jan 19. J Med Chem. 2008. PMID: 18205293 - The regulation and regulatory activities of alternative splicing of the SMN gene.
Singh NN, Androphy EJ, Singh RN. Singh NN, et al. Crit Rev Eukaryot Gene Expr. 2004;14(4):271-85. doi: 10.1615/critreveukaryotgeneexpr.v14.i4.30. Crit Rev Eukaryot Gene Expr. 2004. PMID: 15663357 Review.
Cited by
- Therapeutics development for spinal muscular atrophy.
Sumner CJ. Sumner CJ. NeuroRx. 2006 Apr;3(2):235-45. doi: 10.1016/j.nurx.2006.01.010. NeuroRx. 2006. PMID: 16554261 Free PMC article. Review. - Transcriptional regulation of the cyclin-dependent kinase inhibitor 1A (p21) gene by NFI in proliferating human cells.
Ouellet S, Vigneault F, Lessard M, Leclerc S, Drouin R, Guérin SL. Ouellet S, et al. Nucleic Acids Res. 2006;34(22):6472-87. doi: 10.1093/nar/gkl861. Epub 2006 Nov 27. Nucleic Acids Res. 2006. PMID: 17130157 Free PMC article. - Oxidative Stress Triggers Body-Wide Skipping of Multiple Exons of the Spinal Muscular Atrophy Gene.
Seo J, Singh NN, Ottesen EW, Sivanesan S, Shishimorova M, Singh RN. Seo J, et al. PLoS One. 2016 Apr 25;11(4):e0154390. doi: 10.1371/journal.pone.0154390. eCollection 2016. PLoS One. 2016. PMID: 27111068 Free PMC article. - Age-dependent SMN expression in disease-relevant tissue and implications for SMA treatment.
Ramos DM, d'Ydewalle C, Gabbeta V, Dakka A, Klein SK, Norris DA, Matson J, Taylor SJ, Zaworski PG, Prior TW, Snyder PJ, Valdivia D, Hatem CL, Waters I, Gupte N, Swoboda KJ, Rigo F, Bennett CF, Naryshkin N, Paushkin S, Crawford TO, Sumner CJ. Ramos DM, et al. J Clin Invest. 2019 Nov 1;129(11):4817-4831. doi: 10.1172/JCI124120. J Clin Invest. 2019. PMID: 31589162 Free PMC article. Clinical Trial. - A high-throughput genome-wide RNAi screen identifies modifiers of survival motor neuron protein.
McCormack NM, Abera MB, Arnold ES, Gibbs RM, Martin SE, Buehler E, Chen YC, Chen L, Fischbeck KH, Burnett BG. McCormack NM, et al. Cell Rep. 2021 May 11;35(6):109125. doi: 10.1016/j.celrep.2021.109125. Cell Rep. 2021. PMID: 33979606 Free PMC article.
References
- Lefebvre S., Bürglen L., Reboullet S., Clermont O., Burlet P., Viollet L., Benichou B., Cruaud C., Millasseau P., Zeviani M., et al. Identification and characterization of a spinal muscular atrophy-determining gene. Cell (Cambridge, Mass.) 1995;80:155–165. - PubMed
- Monani U. R., Lorson C. L., Parsons D. W., Prior T. W., Androphy E. J., Burghes A. H., McPherson J. D. A single nucleotide difference that alters splicing patterns distinguishes the SMA gene SMN1 from the copy gene SMN2. Hum. Mol. Genet. 1999;8:1177–1183. - PubMed
- Rochette C. F., Gilbert N., Simard L. R. SMN gene duplication and the emergence of the SMN2 gene occurred in distinct hominids: SMN2 is unique to Homo sapiens. Hum. Genet. 2001;108:255–266. - PubMed
- Kashima T., Manley J. L. A negative element in SMN2 exon 7 inhibits splicing in spinal muscular atrophy. Nat. Genet. 2003;34:460–465. - PubMed
- Monani U. R., Sendtner M., Coovert D. D., Parsons D. W., Andreassi C., Le T. T., Jablonka S., Schrank B., Rossol W., Prior T. W., et al. The human centromeric survival motor neuron gene (SMN2) rescues embryonic lethality in Smn(–/–) mice and results in a mouse with spinal muscular atrophy. Hum. Mol. Genet. 2000;9:333–339. - PubMed
Publication types
MeSH terms
Substances
LinkOut - more resources
Full Text Sources
