Transcription-dependent spatial arrangements of CFTR and adjacent genes in human cell nuclei - PubMed (original) (raw)
Comparative Study
. 2004 Sep 13;166(6):815-25.
doi: 10.1083/jcb.200404107.
Margarida D Amaral, Andreas Englmann, Susanne Lang, Luka A Clarke, Carsten Rudolph, Felix Alt, Kathrin Luther, Carla Braz, Nicolas Sadoni, Joseph Rosenecker, Dirk Schindelhauer
Affiliations
- PMID: 15364959
- PMCID: PMC2172106
- DOI: 10.1083/jcb.200404107
Comparative Study
Transcription-dependent spatial arrangements of CFTR and adjacent genes in human cell nuclei
Daniele Zink et al. J Cell Biol. 2004.
Abstract
We investigated in different human cell types nuclear positioning and transcriptional regulation of the functionally unrelated genes GASZ, CFTR, and CORTBP2, mapping to adjacent loci on human chromosome 7q31. When inactive, GASZ, CFTR, and CORTBP2 preferentially associated with the nuclear periphery and with perinuclear heterochromatin, whereas in their actively transcribed states the gene loci preferentially associated with euchromatin in the nuclear interior. Adjacent genes associated simultaneously with these distinct chromatin fractions localizing at different nuclear regions, in accordance with their individual transcriptional regulation. Although the nuclear localization of CFTR changed after altering its transcription levels, the transcriptional status of CFTR was not changed by driving this gene into a different nuclear environment. This implied that the transcriptional activity affected the nuclear positioning, and not vice versa. Together, the results show that small chromosomal subregions can display highly flexible nuclear organizations that are regulated at the level of individual genes in a transcription-dependent manner.
Figures
Figure 1.
Schematic drawing of the CFTR region. CFTR, GASZ, and CORTBP2 are symbolized by open boxes. Arrows indicate the directions of transcription and the numbers of exons are given by numbers below the genes. The scale at the top shows the DNA length in kb pairs. The boxes below the gene loci indicate lengths and positions of the probes used for FISH specific for GASZ (black), the 5′ end of CFTR (CF1, dark gray), the 3′ end of CFTR (light gray), and CORTBP2 (white).
Figure 2.
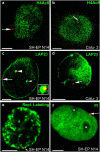
Nuclear localization of CFTR. FISH (red signals) was performed with nuclei from SH-EP N14 (a, c, e, and f) and Calu-3 cells (b and d). Nuclei were immunostained with antibodies against H4Ac8 (a and b, green) or LAP2β (green in c and d). Nuclei were also labeled by replicational pulse labeling (e, green) or were counterstained with propidium iodide (f, green false color). Single light-optical sections are shown and often only one CFTR allele is present in the displayed nuclear plane. (a and b) Arrows point to CFTR alleles associated at the nuclear periphery with chromatin not enriched in H4Ac8 (a, SH-EP N14) or embedded in the nuclear interior into chromatin enriched in H4Ac8 (b, Calu-3). (c) One CFTR allele (arrow) associates at the nuclear periphery with high concentrations of LAP2β. The other CFTR allele (large arrowhead) associates with an invagination of the nuclear periphery into the interior (cross section, green), also containing high concentrations of LAP2β. An enlargement of the FISH signal associated with the invagination is shown in the inset. Only the yellow section of the stained area corresponds to the FISH signal (colocalization of the red FISH signal with the invagination stained in green). The small arrowhead points to a second invagination not associated with a FISH signal. (d) In Calu-3 cells, CFTR (arrow) does not associate with high local concentrations of LAP2β. (e) The replication labeling pattern (green) is typical for the second half of S-phase, with strongly stained perinuclear heterochromatin. The arrow points to a CFTR allele (doublet signal) embedded within the perinuclear heterochromatin. (f) Nucleoli (asterisks) appear unstained in the propidium iodide counterstain (green). The CFTR allele (arrow) is associated with the nuclear periphery, but not with the nucleolar peripheries. Bars, 5 μm.
Figure 3.
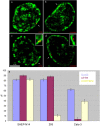
Spatial arrangements of GASZ, CFTR, and CORTBP2. (a–d) Panels show light-optical sections of formaldehyde-fixed nuclei from SH-EP N14 (a and b) and HEK 293 (c and d) cells (bar, 5 μm). CFTR (a and c) and CORTBP2 (b and d) were detected by FISH (red signals). Perinuclear and perinucleolar heterochromatin has been visualized by replication labeling (green). The arrows in a, b, and c, respectively, point to CFTR and CORTBP2 genes embedded within the perinuclear heterochromatin. The arrow in d points to the CORTBP2 locus (doublet signal) localizing within the adjacent euchromatin. The insets in c and d show the corresponding FISH signals and their nuclear environments enlarged. (e) The fractions of FISH signals (violet bars, GASZ; red bars, CFTR; yellow bars, CORTBP2; average ± SD) colocalizing with perinuclear heterochromatin were determined in the cell types indicated. Replication-labeled nuclei as shown in panels a–d were evaluated after FISH. In each case ∼50–60 FISH signals were evaluated.
Figure 4.
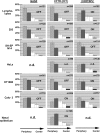
Summary of the erosion analysis results. Nuclei of the seven cell types indicated were hybridized with probes specific for GASZ (left-hand diagrams), CFTR (diagrams in the middle), and CORTBP2 (right-hand diagrams). Nuclei were imaged by epifluorescence microscopy and the 2D image of each nucleus was subdivided into five concentric areas with each area having a thickness of 20% of the nuclear radius as defined by the DAPI counterstain. The positions of FISH signals with regard to these five areas were determined. The five bars in each diagram indicate the fractions of FISH signals in the five concentric areas (average ± SD). The very left bar in each diagram corresponds to the most peripheral area (1), whereas the right bars correspond to the central area (5). For each combination (gene and cell type), 2–8 independent experiments have been performed. n indicates the number of FISH signals evaluated. In addition, on each panel it is indicated whether the gene analyzed was transcriptionally active (on) or inactive (off), as revealed by the RT-PCR analyses (Table I).
Figure 5.
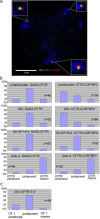
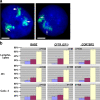
Spatial arrangements of loci as revealed by dual-color FISH. (a) CFTR (green) and CORTBP2 (red) were simultaneously detected by dual-color FISH in a 293 nucleus (enlargements shown in the insets). Chromosome 7 territories are shown in blue (293 nuclei harbor three chromosome 7 territories). (b) The nuclear positions of adjacent loci simultaneously detected in the same nucleus by dual-color FISH were determined with respect to each other. The combinations of gene loci evaluated and the cell types analyzed are indicated. It was evaluated in each case whether CFTR was located more peripheral or more interior, respectively, with regard to the other locus, or whether both loci were juxtaposed with no locus being more interior or peripheral. In all cases for CFTR detection, the CF1 probe from the 5′ region of CFTR was used. A second CFTR-specific probe from the 3′ region of CFTR (compare with Fig. 1) was used in 293 cells, and the orientation of the corresponding FISH signal relative to the CF1-specific signal is shown in c. The bars show for each combination the percentages displaying the indicated orientation (average ± SD). n indicates the number of pairs of loci examined.
Figure 6.
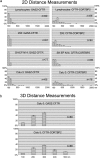
Distance measurements. Adjacent loci were detected by dual-color FISH and the distances between the simultaneously detected loci were measured. The pairs of loci evaluated and the cell types analyzed are indicated. The bars (average ± SD) show for each combination the percentages with distances within a given interval (0–100 nm, 101–200 nm, etc.). The numbers below the x axes denote the distance intervals (nm). (a) 2D distances were measured on projections of the focal planes of nuclei fixed with methanol/acetic acid. (b) 3D distances were measured on the individual focal planes of Calu-3 nuclei fixed with formaldehyde. n indicates the number of pairs of loci analyzed.
Figure 7.
Positioning of CFTR after DRB and TSA treatment. FISH was performed with the CF1 probe on the cell types indicated. Cells were treated with the transcriptional inhibitor DRB or the histone deacetylase inhibitor TSA. For comparison, the results obtained for untreated cells are also included. The localization of FISH signals was determined by erosion analysis. The erosion analysis was performed and the corresponding diagrams were arranged as described in the legend of Fig. 4. In addition, on each panel it is indicated whether the gene analyzed was transcriptionally active (on) or inactive (off), as revealed by RT-PCR analysis. The level of CFTR transcription in Calu-3 cells was reduced to ∼50% after DRB treatment (Table I).
Figure 8.
Positioning of GASZ, CFTR, and CORTBP2 with respect to the chromosome 7 territory. T-lymphocytes, 293 cells, and Calu-3 cells were hybridized with the gene-specific probes (CF1 used for CFTR) and in addition with a painting probe specific for human chromosome 7. The localization of the gene-specific FISH signals was determined with regard to the chromosome 7 territory, as defined by the FISH signal of the painting probe. Gene-specific signals were assigned to three different categories: (1) localization within; (2) at the periphery; or (3) outside of the chromosome 7 territory. (a) Panels show examples (gene-specific signals, red; chromosome 7 territory, green; DAPI counterstain, blue; bars, 5 μm). The arrows in the left-hand panel point to CORTBP2-specific signals positioned within the territories, whereas the arrowhead points to a signal located at the periphery of the chromosome territory. This panel shows a Calu-3 nucleus containing three chromosome 7 territories. Both CORTBP2-specific signals (arrows) shown on the right-hand panel (T-lymphocyte nucleus) were classified as positioned outside of the corresponding chromosome territories. (b) The diagrams summarize the results obtained for the different probes and cell types indicated. Bars indicate the fractions of FISH signals (averages ± SD) located outside (left bars in the diagrams), at the periphery (bars in the middle), or within (right-hand bars) the chromosome 7 territories.
Similar articles
- Transcription-dependent spatial arrangements of CFTR and conserved adjacent loci are not conserved in human and murine nuclei.
Sadoni N, Targosz BS, Englmann A, Fesser S, Koch J, Schindelhauer D, Zink D. Sadoni N, et al. Chromosoma. 2008 Aug;117(4):381-97. doi: 10.1007/s00412-008-0157-5. Epub 2008 Apr 12. Chromosoma. 2008. PMID: 18408947 - The replication timing of CFTR and adjacent genes.
Englmann A, Clarke LA, Christan S, Amaral MD, Schindelhauer D, Zink D. Englmann A, et al. Chromosome Res. 2005;13(2):183-94. doi: 10.1007/s10577-005-0845-4. Chromosome Res. 2005. PMID: 15861307 - Nuclear architecture and gene regulation.
Fedorova E, Zink D. Fedorova E, et al. Biochim Biophys Acta. 2008 Nov;1783(11):2174-84. doi: 10.1016/j.bbamcr.2008.07.018. Epub 2008 Jul 31. Biochim Biophys Acta. 2008. PMID: 18718493 Review. - Perinuclear positioning of the inactive human cystic fibrosis gene depends on CTCF, A-type lamins and an active histone deacetylase.
Muck JS, Kandasamy K, Englmann A, Günther M, Zink D. Muck JS, et al. J Cell Biochem. 2012 Aug;113(8):2607-21. doi: 10.1002/jcb.24136. J Cell Biochem. 2012. PMID: 22422629 - Nuclear architecture, chromosome domains and genetic damage.
Folle GA. Folle GA. Mutat Res. 2008 Mar-Apr;658(3):172-83. doi: 10.1016/j.mrrev.2007.08.005. Epub 2007 Aug 30. Mutat Res. 2008. PMID: 17921046 Review.
Cited by
- Mapping of lamin A- and progerin-interacting genome regions.
Kubben N, Adriaens M, Meuleman W, Voncken JW, van Steensel B, Misteli T. Kubben N, et al. Chromosoma. 2012 Oct;121(5):447-64. doi: 10.1007/s00412-012-0376-7. Epub 2012 May 19. Chromosoma. 2012. PMID: 22610065 Free PMC article. - Chronic viral infection alters PD-1 locus subnuclear localization in cytotoxic CD8+ T cells.
Sacristán C, Youngblood BA, Lu P, Bally APR, Xu JX, McGary K, Hewitt SL, Boss JM, Skok JA, Ahmed R, Dustin ML. Sacristán C, et al. Cell Rep. 2024 Aug 27;43(8):114547. doi: 10.1016/j.celrep.2024.114547. Epub 2024 Jul 30. Cell Rep. 2024. PMID: 39083377 Free PMC article. - Olfactory receptor genes expressed in distinct lineages are sequestered in different nuclear compartments.
Yoon KH, Ragoczy T, Lu Z, Kondoh K, Kuang D, Groudine M, Buck LB. Yoon KH, et al. Proc Natl Acad Sci U S A. 2015 May 5;112(18):E2403-9. doi: 10.1073/pnas.1506058112. Epub 2015 Apr 20. Proc Natl Acad Sci U S A. 2015. PMID: 25897022 Free PMC article. - Spatial genome organization in the formation of chromosomal translocations.
Meaburn KJ, Misteli T, Soutoglou E. Meaburn KJ, et al. Semin Cancer Biol. 2007 Feb;17(1):80-90. doi: 10.1016/j.semcancer.2006.10.008. Epub 2006 Oct 26. Semin Cancer Biol. 2007. PMID: 17137790 Free PMC article. Review. - SAGA and a novel Drosophila export complex anchor efficient transcription and mRNA export to NPC.
Kurshakova MM, Krasnov AN, Kopytova DV, Shidlovskii YV, Nikolenko JV, Nabirochkina EN, Spehner D, Schultz P, Tora L, Georgieva SG. Kurshakova MM, et al. EMBO J. 2007 Dec 12;26(24):4956-65. doi: 10.1038/sj.emboj.7601901. Epub 2007 Nov 22. EMBO J. 2007. PMID: 18034162 Free PMC article.
References
- Amaral, M.D., L.A. Clarke, A.S. Ramalho, S. Beck, F. Broackes-Carter, R. Rowntree, A. Harris, M. Tzetis, B. Steiner, J. Sanz, et al. 2004. Quantitative methods for the analysis of CFTR transcripts/splicing variants. J. Cystic Fibrosis. 3 Suppl 2:17–23. - PubMed
- Ayyanathan, K., M.S. Lechner, P. Bell, G.G. Maul, D.C. Schultz, Y. Yamada, K. Tanaka, K. Torigoe, and F.J. Rauscher III. 2003. Regulated recruitment of HP1 to a euchromatic gene induces mitotically heritable, epigenetic gene silencing: a mammalian cell culture model of gene variegation. Genes Dev. 17:1855–1869. - PMC - PubMed
- Belmont, A.S., M.B. Braunfeld, J.W. Sedat, and D.A. Agard. 1989. Large-scale chromatin structural domains within mitotic and interphase chromosomes in vivo and in vitro. Chromosoma. 98:129–143. - PubMed
- Boyle, S., S. Gilchrist, J.M. Bridger, N.L. Mahy, J.A. Ellis, and W.A. Bickmore. 2001. The spatial organization of human chromosomes within cell nuclei of normal and emerin-mutant cells. Hum. Mol. Genet. 10:211–219. - PubMed
- Brown, K.E., S.S. Guest, S.T. Smale, K. Hahm, M. Merkenschlager, and A.G. Fisher. 1997. Association of transcriptionally silent genes with Ikaros complexes at centromeric heterochromatin. Cell. 91:845–854. - PubMed
Publication types
MeSH terms
Substances
LinkOut - more resources
Full Text Sources
Molecular Biology Databases

