A conserved protein network controls assembly of the outer kinetochore and its ability to sustain tension - PubMed (original) (raw)
A conserved protein network controls assembly of the outer kinetochore and its ability to sustain tension
Iain M Cheeseman et al. Genes Dev. 2004.
Abstract
Kinetochores play an essential role in chromosome segregation by forming dynamic connections with spindle microtubules. Here, we identify a set of 10 copurifying kinetochore proteins from Caenorhabditis elegans, seven of which were previously uncharacterized. Using in vivo assays to monitor chromosome segregation, kinetochore assembly, and the mechanical stability of chromosome-microtubule attachments, we show that this copurifying protein network plays a central role at the kinetochore-microtubule interface. In addition, our analysis suggests that the network is comprised of three groups of proteins that contribute in distinct ways to this interface: KNL proteins act after the assembly of centromeric chromatin to generate the core of the microtubule-binding interface, MIS proteins control the rate and extent of formation of this interface, and NDC proteins are necessary to sustain tension during interactions with spindle microtubules. We also purify a similar set of associated proteins from human cells that includes four novel proteins and has recognizable homologs from each functional class. Thus, this protein network is a conserved constituent of the outer kinetochore, and the functions defined by our analysis in C. elegans are likely to be widely relevant.
Figures
Figure 1.
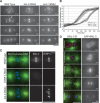
KNL-3 is a kinetochore protein whose depletion results in a kinetochore-null phenotype. (A) KNL-3- and KNL-1-depleted embryos exhibit a similar chromosome segregation defect. Selected images from time-lapse sequences of wild-type, KNL-3-depleted, and KNL-1-depleted embryos are shown. Embryos are from a strain coexpressing GFP-histone H2B to mark the chromosomes (arrow) and GFP-γ-tubulin to visualize spindle poles (arrowheads). Time, in seconds after nuclear envelope breakdown (NEBD), is indicated on the lower right of each panel. Identical phenotypes were observed in 18 KNL-3-depleted embryos. (B) KNL-3- and KNL-1-depleted embryos exhibit quantitatively identical premature spindle pole separation. The kinetics of spindle pole separation are plotted for wild-type (n = 15), KNL-3-depleted (n = 18), and KNL-1-depleted (n = 14) embryos. All sequences were time-aligned with respect to NEBD (0 sec), and the average spindle pole separation was calculated for each time point. Error bars represent the S.E.M. with a confidence interval of 0.95. (C) KNL-3 localizes to the kinetochore throughout mitosis. (Left column) Immunofluorescence images obtained using affinity-purified antibodies. Microtubules are shown in green, DNA in blue, and KNL-3 in red. (Right column) Selected images from a time-lapse sequence of an embryo stably expressing GFP-KNL-3. (D) KNL-3 functions downstream from CENP-CHCP-4 in the kinetochore assembly hierarchy. Directly labeled affinity-purified antibodies were used to analyze KNL-3 and CENP-CHCP-4 localization in wild-type, KNL-3-depleted, and CENP-CHCP-4-depleted embryos. Bars, 10 μm.
Figure 2.
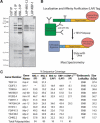
Purification of KNL-1- and KNL-3-interacting proteins from worm extracts. (A) Proteins isolated from worm extracts were fractionated on 14% polyacrylamide gels and visualized by silver staining. (Left panel) Immunoprecipitations with antibodies to GST (as a control), KNL-1, or KNL-3. (Right panel) LAP-tag purifications of MIS-12 and KBP-1. (B) Diagram describing the Localization and Affinity Purification (LAP) tag and the tandem affinity purification scheme. (C) Mass spectrometric analysis of the purifications shown in A indicating the percent sequence coverage obtained for the indicated proteins. For this analysis, the entire eluate was analyzed (not specific bands). KNL-1, KNL-3, and CENP-CHCP-4 are either weakly present or missing in their corresponding immunoprecipitates (indicated by an ⋆) because the 8-M urea elution does not efficiently dissociate antibody-antigen complexes. Therefore, their presence was confirmed using a more stringent secondary elution and Western blotting (data not shown; also see Desai et al. 2003). For IPs, only proteins present in both KNL-1 and KNL-3 IPs, but not in controls, are listed. The predicted molecular mass of each protein as well as the consequence of its depletion on embryonic viability are indicated. EMB refers to >95% embryonic lethality, whereas WT refers to no effect on embryo viability.
Figure 3.
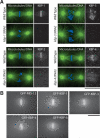
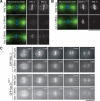
Novel KNL-1/3-interacting proteins localize to kinetochores. (A) Immunofluorescence showing localization of endogenous KBP-1, KBP-2, Spc25KBP-3, and KBP-4 to kinetochores using affinity-purified antibodies. Microtubules are shown in green and DNA in blue. Similar stage embryos following RNAi are shown to demonstrate that the observed localization is specific. (B) Still images showing localization of LAP-tagged (GFP) fusion proteins for MIS-12, KBP-1, Spc25KBP-3, KBP-4, and KBP-5 during metaphase. Bars, 10 μm.
Figure 4.
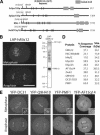
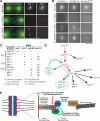
Human cells have a network of interacting proteins similar to that found using KNL-1 and KNL-3 purifications in C. elegans. (A) Similarity between KNL-1, fungal Spc105p, and human AF15q14. Schematic representation of S. cerevisiae Spc105p, Schizosaccharomyces pombe Spc105p, C. elegans KNL-1, and human AF15q14 proteins highlighting the invariant N-terminal [S/G]ILK and RRSVF motifs, the N-terminal MELT repeats, and the C-terminal coiled-coil domain. Position in the protein sequence is shown as a percentage of total length. AF15q14 was identified using a seedtop search (NCBI) of the nonredundant database using three degenerate MELT repeats as an input. There is 17.8% identity and 36.4% similarity between S. pombe Spc105p and human AF15q14, and 17.2% identity and 45.7% similarity between C. elegans KNL-1 and human AF15q14. (B) Localization of LAP-hMis12 to kinetochores in a stable clonal cell line derived from HeLa cells. Bar, 10 μm. (C) Purification of LAP-hMis12 from HeLa cells isolates multiple interacting proteins. Proteins were fractionated on a 13.5% polyacrylamide gel and visualized by silver staining. (D) Mass spectrometric analysis of the purification shown in C indicating the percent sequence coverage for each polypeptide with >5% coverage. A heat-shock protein and several forms of keratin present in the sample are not listed. (E) Imaging of T98G human tissue culture cells transiently expressing YFP fusions to the novel proteins identified in the hMis12 purification. Localization to punctate foci suggests that they localize to kinetochores during metaphase and anaphase. Inset shows blown-up image of paired dots representing sister kinetochores. Bars, 10 μm.
Figure 5.
Depletion of KNL-1- and KNL-3-interacting proteins results in distinct chromosome segregation defects. (A) Spc25KBP-3 depletion results in a phenotype similar to depletion of NDC-80 and Nuf2HIM-10. Still images from time-lapse movies of embryos expressing GFP-histone H2B and GFP-γ-tubulin of either wild-type embryos or embryos depleted of NDC-80 or Spc25KBP-3. The times indicated are relative to NEBD. (B) NDC-80- and Spc25KBP-3-depleted embryos exhibit similar premature spindle pole separation. The graph shows spindle pole separation kinetics in wild-type (n = 15), NDC-80-depleted (n = 12), and Spc25KBP-3-depleted (n = 8) embryos. All sequences were time-aligned with respect to NEBD (0 sec), and the average spindle pole separation was calculated for each time point. Error bars represent the S.E.M. with a confidence interval of 0.95. (C) Depletion of MIS-12, KBP-1, KBP-2, and KBP-4 results in chromosome segregation defects. Still images from representative time-lapse movies are shown. The arrow indicates poor resolution of sister chromatids. The arrowheads indicate premature rounding of chromosome masses during anaphase. The numbers in italics on the top left of each panel are seconds after NEBD. The numbers on the lower right are time in seconds relative to visible chromosome separation. Bars, 10 μm.
Figure 6.
Depletion of MIS proteins results in a unique spindle “bounce” phenotype. (A) Still images from time-lapse movies of embryos expressing GFP-histone H2B and GFP-γ-tubulin were processed using an algorithm to fix the _X_-Y coordinate of one spindle pole (red arrow) throughout a movie and to rotate each frame such that the second spindle pole was at the same _Y_-coordinate. A 12-pixel-wide rectangular strip that included both spindle poles was cut from each frame and vertically montaged to generate a kymograph. The kymographs were initiated at NEBD, and the time interval between consecutive strips was 10 sec. In the kymographs, separation of both spindle poles (arrows) and the chromosomes (arrowheads) is visible. Bar, 10 μm. (B) Graph showing traces of spindle pole separation in 15 individual MIS-12-depleted embryos time aligned with respect to the onset of visible chromosome separation. (C) Graph plotting average spindle pole separation versus time for wild-type (n = 15), KNL-3-depleted (n = 18), MIS-12-depleted (n = 16), KBP-1-depleted (n = 11), KBP-2-depleted (n = 20), and KBP-4-depleted (n = 10) embryos aligned with respect to the onset of visible chromosome separation. The kinetic profiles for MIS-12-, KBP-1-, and KBP-2-depleted embryos are virtually indistinguishable. Because there is no chromosome separation in KNL-3-depleted embryos, the KNL-3 trace was aligned to maintain the same relationship with the wild-type trace shown in Figure 1. The average maximum elongation rates are 4.6 μm/min for mis-12(RNAi); 5.7 μm/min for kbp-1(RNAi); 5.0 μm/min for kbp-2(RNAi); 5.4 μm/min for knl-3(RNAi); 5.4 μm/min for ndc-80(RNAi); and 2.5 μm/min for wild-type prometaphase spindle elongation. Error bars represent the S.E.M. with a confidence interval of 0.95.
Figure 7.
MIS proteins control the rate and extent of outer kinetochore assembly. (A) Depletion of KBP-2 results in a severe, but variable, defect in KNL-3 localization. Microtubules are shown in green and DNA in blue in the panels on the left. Two kbp-2(RNAi) embryos are shown to illustrate the variability in KNL-3 localization. In both, KNL-3 localization is significantly reduced relative to wild type. In the bottom embryo, more KNL-3 is detectable. All images were acquired and processed equivalently. (B) Depletion of MIS-12 reduces KNL-3 localization but does not affect CENP-CHCP-4. Immunofluorescence images showing the localization of KNL-3 and CENP-CHCP-4 in wild-type and MIS-12-depleted embryos. (C) Live imaging indicates that depletion of MIS proteins causes a delay and reduction in kinetochore targeting of KNL-3 and Spc25KBP-3. Selected images from time-lapse sequences of wild-type and KBP-1-depleted embryos expressing GFP-KNL-3 (top two rows) or GFP-Spc25KBP-3 (bottom two rows). The times indicated are minutes prior to the onset of visible chromosome separation. Bars, 10 μm.
Figure 8.
Placement of KNL, MIS, and NDC proteins in the molecular hierarchy of kinetochore assembly. (A) KNL-3 functions upstream of KNL-1. Immunofluorescence images showing the localization of KNL-3 and KNL-1 in wild-type, KNL-3-depleted, and KNL-1-depleted embryos. Microtubules are shown in green and DNA in blue in the panels on the left. Bar, 10 μm. (B) Still images from time-lapse sequences showing the localization of selected kinetochore markers (labeled on the top of each column) in embryos depleted of the indicated kinetochore components (labeled to the left of each row). Bar, 10 μm. (C) Summary of localization dependencies. Immunofluorescence using affinity-purified antibodies and live cell analysis of GFP fusions were used to examine localization dependencies as in A and B. Some data for KNL-1 and NDC-80 are from Desai et al. (2003). Five to 10 embryos were examined for each combination. (D) Diagram summarizing the targeting dependencies between C. elegans kinetochore proteins. (E) Summary model incorporating the dependency data summarized in D and the functions defined for the KNL, MIS, and NDC protein groups.
Similar articles
- KNL-1 directs assembly of the microtubule-binding interface of the kinetochore in C. elegans.
Desai A, Rybina S, Müller-Reichert T, Shevchenko A, Shevchenko A, Hyman A, Oegema K. Desai A, et al. Genes Dev. 2003 Oct 1;17(19):2421-35. doi: 10.1101/gad.1126303. Genes Dev. 2003. PMID: 14522947 Free PMC article. - Kinetochore Recruitment of the Spindle and Kinetochore-Associated (Ska) Complex Is Regulated by Centrosomal PP2A in Caenorhabditis elegans.
Lange KI, Suleman A, Srayko M. Lange KI, et al. Genetics. 2019 Jun;212(2):509-522. doi: 10.1534/genetics.119.302105. Epub 2019 Apr 24. Genetics. 2019. PMID: 31018924 Free PMC article. - The outer kinetochore protein KNL-1 contains a defined oligomerization domain in nematodes.
Kern DM, Kim T, Rigney M, Hattersley N, Desai A, Cheeseman IM. Kern DM, et al. Mol Biol Cell. 2015 Jan 15;26(2):229-37. doi: 10.1091/mbc.E14-06-1125. Epub 2014 Nov 19. Mol Biol Cell. 2015. PMID: 25411336 Free PMC article. - Merotelic kinetochores in mammalian tissue cells.
Salmon ED, Cimini D, Cameron LA, DeLuca JG. Salmon ED, et al. Philos Trans R Soc Lond B Biol Sci. 2005 Mar 29;360(1455):553-68. doi: 10.1098/rstb.2004.1610. Philos Trans R Soc Lond B Biol Sci. 2005. PMID: 15897180 Free PMC article. Review. - "Holo"er than thou: chromosome segregation and kinetochore function in C. elegans.
Maddox PS, Oegema K, Desai A, Cheeseman IM. Maddox PS, et al. Chromosome Res. 2004;12(6):641-53. doi: 10.1023/B:CHRO.0000036588.42225.2f. Chromosome Res. 2004. PMID: 15289669 Review.
Cited by
- Distinct organization and regulation of the outer kinetochore KMN network downstream of CENP-C and CENP-T.
Rago F, Gascoigne KE, Cheeseman IM. Rago F, et al. Curr Biol. 2015 Mar 2;25(5):671-7. doi: 10.1016/j.cub.2015.01.059. Epub 2015 Feb 5. Curr Biol. 2015. PMID: 25660545 Free PMC article. - SUMOylated NKAP is essential for chromosome alignment by anchoring CENP-E to kinetochores.
Li T, Chen L, Cheng J, Dai J, Huang Y, Zhang J, Liu Z, Li A, Li N, Wang H, Yin X, He K, Yu M, Zhou T, Zhang X, Xia Q. Li T, et al. Nat Commun. 2016 Oct 3;7:12969. doi: 10.1038/ncomms12969. Nat Commun. 2016. PMID: 27694884 Free PMC article. - Proteomics-based methods for discovery, quantification, and validation of protein-protein interactions.
Miteva YV, Budayeva HG, Cristea IM. Miteva YV, et al. Anal Chem. 2013 Jan 15;85(2):749-68. doi: 10.1021/ac3033257. Epub 2012 Dec 12. Anal Chem. 2013. PMID: 23157382 Free PMC article. Review. No abstract available. - Genetic interactions of separase regulatory subunits reveal the diverged Drosophila Cenp-C homolog.
Heeger S, Leismann O, Schittenhelm R, Schraidt O, Heidmann S, Lehner CF. Heeger S, et al. Genes Dev. 2005 Sep 1;19(17):2041-53. doi: 10.1101/gad.347805. Genes Dev. 2005. PMID: 16140985 Free PMC article. - Quiescent Cells Actively Replenish CENP-A Nucleosomes to Maintain Centromere Identity and Proliferative Potential.
Swartz SZ, McKay LS, Su KC, Bury L, Padeganeh A, Maddox PS, Knouse KA, Cheeseman IM. Swartz SZ, et al. Dev Cell. 2019 Oct 7;51(1):35-48.e7. doi: 10.1016/j.devcel.2019.07.016. Epub 2019 Aug 15. Dev Cell. 2019. PMID: 31422918 Free PMC article.
References
- Bharadwaj R., Qi, W., and Yu, H. 2004. Identification of two novel components of the human NDC80 kinetochore complex. J. Biol. Chem. 279: 13076-13085. - PubMed
- Buchwitz B.J., Ahmad, K., Moore, L.L., Roth, M.B., and Henikoff, S. 1999. A histone-H3-like protein in C. elegans. Nature 401: 547-548. - PubMed
- Cheeseman I.M. and Desai, A. 2004. Cell division: Feeling tense enough? Nature 428: 32-33. - PubMed
- Cleveland D.W., Mao, Y., and Sullivan, K.F. 2003. Centromeres and kinetochores: From epigenetics to mitotic checkpoint signaling. Cell 112: 407-421. - PubMed
Publication types
MeSH terms
Substances
LinkOut - more resources
Full Text Sources
Other Literature Sources
Molecular Biology Databases
