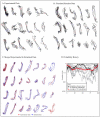
Long-range interphase chromosome organization in Drosophila: a study using color barcoded fluorescence in situ hybridization and structural clustering analysis - PubMed (original) (raw)
Long-range interphase chromosome organization in Drosophila: a study using color barcoded fluorescence in situ hybridization and structural clustering analysis
Michael G Lowenstein et al. Mol Biol Cell. 2004 Dec.
Abstract
We have developed a color barcode labeling strategy for use with fluorescence in situ hybridization that enables the discrimination of multiple, identically labeled loci. Barcode labeling of chromosomes provides long-range path information and allows structural analysis at a scale and resolution beyond what was previously possible. Here, we demonstrate the use of a three-color, 13-probe barcode for the structural analysis of Drosophila chromosome 2L in blastoderm stage embryos. We observe the chromosome to be strongly polarized in the Rabl orientation and for some loci to assume defined positions relative to the nuclear envelope. Our analysis indicates packing approximately 15- to 28-fold above the 30-nm fiber, which varies along the chromosome in a pattern conserved across embryos. Using a clustering implementation based on rigid body alignment, our analysis suggests that structures within each embryo represent a single population and are effectively modeled as oriented random coils confined within nuclear boundaries. We also found an increased similarity between homologous chromosomes that have begun to pair. Chromosomes in embryos at equivalent developmental stages were found to share structural features and nuclear localization, although size-related differences that correlate with the cell cycle also were observed. The methodology and tools we describe provide a direct means for identifying developmental and cell type-specific features of higher order chromosome and nuclear organization.
Figures
Figure 1.
Experimental design. (A) A three-color, 13-probe barcode was designed which maps to D. melanogaster chromosome 2L. Probe localizations are based on release 3 of the Drosophila Genome Project Map. Euchromatin is shown in black (22.2 Mbp), heterochromatin is shown in gray mesh (6.2 Mbp), and the gray circle labeled C indicates the centromere. The probe labeled 13 maps to the histone locus and was labeled in all colors. The remaining probes were labeled with one color each. (B) The cut and labeled barcode probes were hybridized to cycle 14 Drosophila embryos. (C) Embryos were imaged using 3D wide-field fluorescence microscopy, and the data sets were deconvolved. (D) Nuclei and probe signals were segmented. (E) Chromosome paths were deduced using criteria described in the text. (F) The set of traces was subject to structural analysis.
Figure 2.
Barcode FISH data set and volume-rendered, traced view. (A) Deconvolved and wavelength-aligned 1-μm projection through a region of the embryo hybridized using the barcode shown in Figure 1A. The four channels were imaged sequentially and are false colored as follows: FITC, green; Rhod, red; Cy5, blue; and DAPI, gray. The DAPI channel has been inverted to provide a clearer view of the probe hybridization. Bar, 5 μm. (B) One traced nucleus from the data set shown in A. Volume rendering and model overlay displayed using ChromosomeViewer and VolumeViewer extensions to Chimera. Deduced path connectivity is shown as an interpolated spline curve, and the nuclear envelope is shown as a mesh. Bar, 1 μm.
Figure 3.
Clustering and mixture analysis. Analysis of interval 1–6 is used to demonstrate the method. In A–C, clusters with three or more traces at 80% completion are shown. (A) Experimental data. (B) Simulated random coil data. (C) Merged experimental and simulated data. (D) Probability of observed segregation of traces into clusters over the course of clustering (black line). Values near 1 indicate traces from the two data sets distribute randomly among clusters and thus the data sets were statistically inseparable. We also generated nine more simulated data sets with the same parameters, merged each in turn with the experimental data set and clustered as described above. Probability histories for these nine simulations are shown in gray. The log average for all 10 simulations is shown in red. Multiple simulations were run to reduce the influence of particular structures generated in any one simulation. Using mixture analysis, the experimental and simulated data were statistically inseparable. The results indicate that the experimental data represent one structural population that is effectively modeled as a Gaussian coil.
Figure 4.
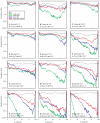
Summary of mixture analysis for several intervals with simulation models. Each line in each graph is the log average probability from 10 sets of simulated data merged with the experimental data and subject to mixture analysis. The results are shown for a set of intervals varying in the number of labels (n), the groups spanned by the labels (g), and the overall base pair separation between the first and last label (mb). For each interval, results from four analyses are shown. Two sets of simulated data generated with the same parameters as a control (gray), experimental data merged with random chains (green), experimental data merged with Rabl chains (blue), and experimental data merged with confined-Rabl chains (red). The control data sets were inseparable for all intervals. With the exception of the 4–6 interval, all models were essentially equal at the shorter intervals. As the intervals increased in size, the probability values drop, indicating that the experimental data and the random coil traces have separated into distinct clusters. Although the Rabl and confined-Rabl data also showed decreased goodness of fit, it was to a lesser degree. Overall, the confine-Rabl was clearly the best for modeling the data. Only for the very longest intervals (3–10, 4–12, 6–13, and 1–13) was it unable to generate data that could be separated from the experimental data over the course of clustering.
Figure 5.
Mixture Analysis of DS1 and DS5. For each interval, the probability history is shown on the left, and the final cluster average structures for each data set clustered independently are shown on the right, aligned, and overlaid. Except for intervals 1–3 and 1–6, the data sets are separable. Separability increases with interval size in parallel with size differences in the average structures. Despite this, the final cluster average shapes are themselves very similar. This is particularly obvious with the intervals 1–6 (B), 7–12 (D), 1–9 (F), and 4–12 (G). Comparison of the final cluster average structures, particularly for intervals 6–10 (E) and 4–12 (G), shows not only size differences, but also a wider, more open conformation of DS1 relative to DS5. Together with the nuclear height analysis that indicates DS1 has progress farther into interphase, this suggests Rabl polarization increases through the cell cycle.
Analysis of pairwise distance statistics. Genomic distance (∂bp) versus average spatial distance squared (
) for all probe pairs in the barcode are plotted for DS1 (A) and DS5 (B). The two lines in each graph correspond to the line-fit for probes separated by <4 Mbp (dotted line) or >4 Mbp (solid line). The steeper line-fit for probes >4 Mbp reflects the Rabl orientation, which extends the chromosome. Both above and below 4 Mbp, the DS1 line-fit slopes are steeper than those for DS5 because the DS1 structures are larger. Interestingly, both data sets display similar deviations from the line-fit, which implies an underlying structural cause. This can be seen clearly in C, which plots the residuals from the line-fits of DS1 versus DS5. To estimate compaction, we plot genomic distance (∂bp) versus average spatial distance () for all probe pairs in the DS1 data (D). From the points <4 Mbp, we estimate compaction at 1066× and from the points >4 Mbp we estimate compaction at 740×.</d
Figure 7.
Pairwise distributions. The pairwise distance histograms for adjacent probe pairs were evaluated. As expected for a single structural population, these distributions were unimodal (one example is shown in A). We next tested whether there was a correlation in compaction between adjacent segments. After determining the population average distance for each probe pair, a z score was calculated for each trace. In B, the z score for the 2–3 segment is plotted against the z score for the 3–4 segment (from the same trace). There is no correlation between the measures. Other probe pairs behaved similarly. One example angle distribution (probes 2–3-4) is shown in C. The roughly sin(ø) distribution is as expected based on a random coil model.
Figure 8.
Visual plot of nuclear localization. We have plotted the average distance to the nuclear envelope against the average Rabl position for a few labels. Only 1 label from each group is shown for clarity (from the bottom, labels 2, 5, 8, 11, and 13). The results for DS1 and DS5 are overlaid. Although the envelope localizations were not statistically identical in both data sets, the average positions are qualitatively similar. The slight differences in Rabl positions between the two data sets reflect differences in overall size and the greater Rabl polarization of DS1 relative to DS5.
Similar articles
- The pattern of chromosome folding in interphase is outlined by the linear gene density profile.
Boutanaev AM, Mikhaylova LM, Nurminsky DI. Boutanaev AM, et al. Mol Cell Biol. 2005 Sep;25(18):8379-86. doi: 10.1128/MCB.25.18.8379-8386.2005. Mol Cell Biol. 2005. PMID: 16135824 Free PMC article. - Reversible chromosome condensation induced in Drosophila embryos by anoxia: visualization of interphase nuclear organization.
Foe VE, Alberts BM. Foe VE, et al. J Cell Biol. 1985 May;100(5):1623-36. doi: 10.1083/jcb.100.5.1623. J Cell Biol. 1985. PMID: 3921555 Free PMC article. - The onset of homologous chromosome pairing during Drosophila melanogaster embryogenesis.
Hiraoka Y, Dernburg AF, Parmelee SJ, Rykowski MC, Agard DA, Sedat JW. Hiraoka Y, et al. J Cell Biol. 1993 Feb;120(3):591-600. doi: 10.1083/jcb.120.3.591. J Cell Biol. 1993. PMID: 8425892 Free PMC article. - Looking at diploid interphase chromosomes.
Gunawardena S, Rykowski M. Gunawardena S, et al. Methods Cell Biol. 1994;44:393-409. doi: 10.1016/s0091-679x(08)60925-5. Methods Cell Biol. 1994. PMID: 7707965 Review. No abstract available. - Chromosome positioning in the interphase nucleus.
Parada L, Misteli T. Parada L, et al. Trends Cell Biol. 2002 Sep;12(9):425-32. doi: 10.1016/s0962-8924(02)02351-6. Trends Cell Biol. 2002. PMID: 12220863 Review.
Cited by
- Real-Time Multistep Asymmetrical Disassembly of Nucleosomes and Chromatosomes Visualized by High-Speed Atomic Force Microscopy.
Onoa B, Díaz-Celis C, Cañari-Chumpitaz C, Lee A, Bustamante C. Onoa B, et al. ACS Cent Sci. 2023 Dec 22;10(1):122-137. doi: 10.1021/acscentsci.3c00735. eCollection 2024 Jan 24. ACS Cent Sci. 2023. PMID: 38292612 Free PMC article. - Ultrastructure and fractal property of chromosomes in close-to-native yeast nuclei visualized using X-ray laser diffraction.
Uezu S, Yamamoto T, Oide M, Takayama Y, Okajima K, Kobayashi A, Yamamoto M, Nakasako M. Uezu S, et al. Sci Rep. 2023 Jul 5;13(1):10802. doi: 10.1038/s41598-023-37733-6. Sci Rep. 2023. PMID: 37407674 Free PMC article. - The three-dimensional genome organization of Drosophila melanogaster through data integration.
Li Q, Tjong H, Li X, Gong K, Zhou XJ, Chiolo I, Alber F. Li Q, et al. Genome Biol. 2017 Jul 31;18(1):145. doi: 10.1186/s13059-017-1264-5. Genome Biol. 2017. PMID: 28760140 Free PMC article. - Three-dimensional Organization of Polytene Chromosomes in Somatic and Germline Tissues of Malaria Mosquitoes.
George P, Kinney NA, Liang J, Onufriev AV, Sharakhov IV. George P, et al. Cells. 2020 Feb 1;9(2):339. doi: 10.3390/cells9020339. Cells. 2020. PMID: 32024176 Free PMC article. - Revealing Gene Function and Transcription Relationship by Reconstructing Gene-Level Chromatin Interaction.
Liu L, Li QZ, Jin W, Lv H, Lin H. Liu L, et al. Comput Struct Biotechnol J. 2019 Jan 31;17:195-205. doi: 10.1016/j.csbj.2019.01.011. eCollection 2019. Comput Struct Biotechnol J. 2019. PMID: 30828411 Free PMC article.
References
- Agard, D.A., Hiraoka, Y., Shaw, P., and Sedat, J.W. (1989). Fluorescence microscopy in three dimensions. Methods Cell Biol. 30, 353-377. - PubMed
- Alberts, B., Johnson, A., Lewis, J., Raff, M., Roberts, K., and Walter, P. (2002). Molecular Biology of the Cell, New York, NY: Garland Publishing.
- Anderson, K.V., and Lengyel, J.A. (1981). Changing rates of DNA and RNA synthesis in Drosophila embryos. Dev Biol. 82, 127-138. - PubMed
- Brown, K.E., Guest, S.S., Smale, S.T., Hahm, K., Merkenschlager, M., and Fisher, A.G. (1997). Association of transcriptionally silent genes with Ikaros complexes at centromeric heterochromatin. Cell 91, 845-854. - PubMed
Publication types
MeSH terms
LinkOut - more resources
Full Text Sources
Other Literature Sources
Molecular Biology Databases


