Longitudinal mapping of cortical thickness and brain growth in normal children - PubMed (original) (raw)
Longitudinal mapping of cortical thickness and brain growth in normal children
Elizabeth R Sowell et al. J Neurosci. 2004.
Abstract
Recent advances in magnetic resonance imaging (MRI) technology now allow the tracing of developmental changes in the brains of children. We applied computer-matching algorithms and new techniques for measuring cortical thickness (in millimeters) to the structural MRI images of 45 children scanned twice (2 yr apart) between the ages 5 and 11. Changes in brain size were also assessed, showing local brain growth progressing at a rate of approximately 0.4-1.5 mm per year, most prominently in frontal and occipital regions. Estimated cortical thickness ranged from 1.5 mm in occipital regions to 5.5 mm in dorsomedial frontal cortex. Gray matter thinning coupled with cortical expansion was highly significant in right frontal and bilateral parieto-occipital regions. Significant thickening was restricted to left inferior frontal (Broca's area) and bilateral posterior perisylvian (Wernicke's area on the left) regions. In the left hemisphere, gray matter thickness was correlated with changing cognitive abilities. For the first time, developmental changes in gray matter thickness, brain size, and structure-function relationships have been traced within the same individuals studied longitudinally during a time of rapid cognitive development.
Figures
Figure 1.
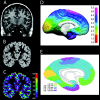
_A_-C, Cortical thickness maps: original T1-weighted image for one representative subject (A), tissue segmented image (B), gray matter thickness image where thickness is progressively coded in millimeters from inner to outer layers of cortex using the 3D Eikonal Fire equation (C). Note that the images were resampled to a voxel size of 0.33 mm cubed, so the thickness measures are at a submillimeter level of precision according to the color bar on the right (in millimeters). _A_-C are sliced at the same level in all three image volumes from the same subject. D is an in vivo average cortical thickness map created from our 45 subjects at their first scan. The brain surface is color coded according to the color bar where thickness is shown in millimeters. E, Our average thickness map can be compared with an adapted version of the 1929 cortical thickness map of Von Economo (1929). Color coding has been applied over Von Economo's original stippling pattern, respecting the boundaries of the original work, to highlight the similarities between the two maps.
Figure 2.
Error estimation maps. A, In the top row, a map of the average absolute value of the cortical thickness difference between short-interval scans for the five subjects is shown. The average error estimate for these subjects ranges from 0 to 1.4 mm. B, To estimate the error for each individual in the larger group of 45 subjects, we divided the average error maps by the square root of 45 minus 1. Thus, the estimated error for each of the 45 subjects ranges from 0 to ∼0.15 mm, which is considerably less than the maturational difference observed in these 45 children over a 2 year interval (C), which ranges regionally from -0.6 to 0.3 mm.
Figure 3.
Regions of interest used in the permutation analyses. Lateral regions are color coded as follows: ventral frontal, yellow; dorsal frontal, pink; temporal, dark blue; occipital, green; parietal, light blue; perisylvian, brick red [created from a statistical map published previously (Sowell et al., 2003)]. Medial regions are color coded as follows: dorsal frontal, purple; ventral frontal, olive green; parietal, dark blue; occipital, red; callosal brainstem area (not tested in permutations), white.
Figure 4.
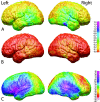
Average cortical thickness. Shown here are left and right, medial and lateral, and top views of average cortical thickness maps for all 45 subjects at time 1. Cortical thickness is shown in color representing millimeters according to the color bar.
Figure 5.
Annualized rate of change in cortical thickness. Shown in this figure is the average rate of change in cortical thickness in millimeters according to the color bar on the right. Maximum gray matter loss is shown in shades of red, and maximum gray matter gain is shown in shades of blue.
Figure 6.
One-sample t test map for gray matter thickness. These brain maps show the statistical significance of annualized change in cortical thickness measures. Color coding represents t values at each cortical surface point according to the left color bar (ranging from t = -3.0 to t = 3.0), and significant values are overlaid in shades of red [significant thickness decreases (TD)] and white [significant thickness increases (TI)] according to the color bar on the right. Arrows point to the three regions of significant gray matter thickness increases, representative of the only three regions to withstand permutation correction for multiple comparisons for thickness increase shown in Table 1.
Figure 7.
Annualized rate of change in DFC (lateral surface) and DFC-H (medial surface). Brain maps showing the annualized rate of change in DFC in millimeters according to the color bar. Corpus callosum and brainstem regions have been masked out of the midline views. Note the most prominent growth shown in red where brain size increases on average 0.5-1.0 mm per year.
Figure 8.
One-sample t test map for radial expansion (or shrinkage). These brain maps show the statistical significance of annualized brain growth measures. Note that the color coding is inverse of that shown in Figure 6. As in both figures, we wanted to highlight the most prominent changes in red (gray matter loss for thickness but brain growth for DFC-H). Color coding represents t values at each cortical surface point according to the left color bar (ranging from t = -3.0 to t = 3.0), and significant values overlaid in shades of red [significant brain growth (BG)] and white [significant brain shrinkage (BS); according to the color bar on the right].
Figure 9.
Brain-behavior maps for vocabulary and cortical thickness. These maps show the p value for negative correlations between change in cortical thickness (time 2 minus time 1) and change in vocabulary raw scores (time 2 minus time 1). Negative p values (i.e., regions where greater thinning was associated with greater vocabulary improvement) are represented in color according to the color bar, and regions in white were not significant. Positive correlations were not significant in the permutation analyses for any of the ROIs and are not shown here.
Similar articles
- Longitudinal changes in cortical thickness in autism and typical development.
Zielinski BA, Prigge MB, Nielsen JA, Froehlich AL, Abildskov TJ, Anderson JS, Fletcher PT, Zygmunt KM, Travers BG, Lange N, Alexander AL, Bigler ED, Lainhart JE. Zielinski BA, et al. Brain. 2014 Jun;137(Pt 6):1799-812. doi: 10.1093/brain/awu083. Epub 2014 Apr 22. Brain. 2014. PMID: 24755274 Free PMC article. - Genetic influences on thinning of the cerebral cortex during development.
van Soelen IL, Brouwer RM, van Baal GC, Schnack HG, Peper JS, Collins DL, Evans AC, Kahn RS, Boomsma DI, Hulshoff Pol HE. van Soelen IL, et al. Neuroimage. 2012 Feb 15;59(4):3871-80. doi: 10.1016/j.neuroimage.2011.11.044. Epub 2011 Dec 1. Neuroimage. 2012. PMID: 22155028 - Neuroanatomical Changes Underlying Vertical HIV Infection in Adolescents.
Yu X, Gao L, Wang H, Yin Z, Fang J, Chen J, Li Q, Xu H, Gui X. Yu X, et al. Front Immunol. 2019 Apr 17;10:814. doi: 10.3389/fimmu.2019.00814. eCollection 2019. Front Immunol. 2019. PMID: 31110499 Free PMC article. - Mapping changes in the human cortex throughout the span of life.
Sowell ER, Thompson PM, Toga AW. Sowell ER, et al. Neuroscientist. 2004 Aug;10(4):372-92. doi: 10.1177/1073858404263960. Neuroscientist. 2004. PMID: 15271264 Review. - Anatomical brain magnetic resonance imaging of typically developing children and adolescents.
Gerber AJ, Peterson BS, Giedd JN, Lalonde FM, Celano MJ, White SL, Wallace GL, Lee NR, Lenroot RK. Gerber AJ, et al. J Am Acad Child Adolesc Psychiatry. 2009 May;48(5):465-470. doi: 10.1097/CHI.0b013e31819f2715. J Am Acad Child Adolesc Psychiatry. 2009. PMID: 19395901 Free PMC article. Review. No abstract available.
Cited by
- The Longitudinal Relationship Between Brain Morphology and Obsessive-Compulsive Symptoms in Children From the General Population.
Weeland CJ, Vriend C, Tiemeier H, van den Heuvel OA, White T. Weeland CJ, et al. JAACAP Open. 2023 Dec 25;2(2):126-134. doi: 10.1016/j.jaacop.2023.11.003. eCollection 2024 Jun. JAACAP Open. 2023. PMID: 39554206 Free PMC article. - Chronic Δ9-tetrahydrocannabinol exposure in adolescent nonhuman primates: persistent abnormalities in economic demand and brain functional connectivity.
Kangas BD, Deshpande HU, Withey SL, Spealman RD, Bergman J, Kohut SJ. Kangas BD, et al. Neuropsychopharmacology. 2024 Nov 13. doi: 10.1038/s41386-024-02024-9. Online ahead of print. Neuropsychopharmacology. 2024. PMID: 39538014 - Structural development and brain asymmetry in the fronto-limbic regions in preschool-aged children.
Lee GY, Youn YA, Jang YH, Kim H, Lee JY, Lee YJ, Jung M, Lee HJ. Lee GY, et al. Front Pediatr. 2024 Oct 1;12:1362409. doi: 10.3389/fped.2024.1362409. eCollection 2024. Front Pediatr. 2024. PMID: 39411282 Free PMC article. - The genetics of spatiotemporal variation in cortical thickness in youth.
Schmitt JE, Alexander-Bloch A, Seidlitz J, Raznahan A, Neale MC. Schmitt JE, et al. Commun Biol. 2024 Oct 10;7(1):1301. doi: 10.1038/s42003-024-06956-2. Commun Biol. 2024. PMID: 39390064 Free PMC article. - Meta-analysis of the effect of plyometric training on the athletic performance of youth basketball players.
Zhou JY, Wang X, Hao L, Ran XW, Wei W. Zhou JY, et al. Front Physiol. 2024 Sep 20;15:1427291. doi: 10.3389/fphys.2024.1427291. eCollection 2024. Front Physiol. 2024. PMID: 39376898 Free PMC article. Review.
References
- Annese J, Pitiot A, Dinov ID, Toga AW (2004) A myelo-architectonic method for the structural classification of cortical areas. NeuroImage 21: 15-26. - PubMed
- Briggs GG, Nebes RD (1975) Patterns of hand preference in a student population. Cortex 11: 230-238. - PubMed
- Conel JL (1967) The postnatal development of the human cerebral cortex. VIII. The cortex of the six-year child. Cambridge: Harvard UP.
- Courchesne E, Chisum HJ, Townsend J, Cowles A, Covington J, Egaas B, Harwood M, Hinds S, Press GA (2000) Normal brain development and aging: quantitative analysis at in vivo MR imaging in healthy volunteers. Radiology 216: 672-682. - PubMed
- Duvernoy HM, Cabanis EA, Vannson JL (1991) The human brain: surface, three-dimensional sectional anatomy and MRI. New York: Springer.
Publication types
MeSH terms
Grants and funding
- K01 MH01733/MH/NIMH NIH HHS/United States
- R21 DA015878/DA/NIDA NIH HHS/United States
- P41 RR13642/RR/NCRR NIH HHS/United States
- 002922D/PHS HHS/United States
- NS3753/NS/NINDS NIH HHS/United States
- P41 RR013642/RR/NCRR NIH HHS/United States
- R21 DA15878/DA/NIDA NIH HHS/United States
LinkOut - more resources
Full Text Sources
Other Literature Sources


