Endophilin B1 is required for the maintenance of mitochondrial morphology - PubMed (original) (raw)
Endophilin B1 is required for the maintenance of mitochondrial morphology
Mariusz Karbowski et al. J Cell Biol. 2004.
Abstract
We report that a fatty acyl transferase, endophilin B1, is required for maintenance of mitochondrial morphology. Down-regulation of this protein or overexpression of endophilin B1 lacking the NH(2)-terminal lipid-modifying domain causes striking alterations of the mitochondrial distribution and morphology. Dissociation of the outer mitochondrial membrane compartment from that of the matrix, and formation of vesicles and tubules of outer mitochondrial membrane, was also observed in both endophilin B1 knockdown cells and after overexpression of the truncated protein, indicating that endophilin B1 is required for the regulation of the outer mitochondrial membrane dynamics. We also show that endophilin B1 translocates to the mitochondria during the synchronous remodeling of the mitochondrial network that has been described to occur during apoptosis. Double knockdown of endophilin B1 and Drp1 leads to a mitochondrial phenotype identical to that of the Drp1 single knockdown, a result consistent with Drp1 acting upstream of endophilin B1 in the maintenance of morphological dynamics of mitochondria.
Figures
Figure 1.
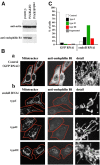
Effects of endophilin B1 RNAi on mitochondrial morphology. (A) Reduction of endophilin B1 levels after transfection with endoB RNAi vector. Control, hygromycin-resistant GFP RNAi, or endoB RNAi HeLa cells harvested 6 d after transfection with GFP- and endophilin B1–silencing vectors were analyzed for endophilin B1 by Western blotting. Actin was used as a loading control. (B) GFP RNAi (a) and endoB RNAi (b) cells were stained with Mitotracker and anti–endophilin B1 antibody and analyzed by confocal microscopy. Cells were divided into five groups based on the morphology of the mitochondrial network (see text). Representative images of four types are shown. (C) The percentage of GFP RNAi (n = 531) and endoB RNAi (n = 417) cells in each of five categories was scored. (D) Examples of mitochondrial network appearances in untransfected HeLa (a), GFP RNAi (b), and endoB RNAi (c) cells. Note the high diameter variability and unusual branching patterns of mitochondria in endoB RNAi cells. (E) Reconstitution of the mitochondrial phenotype in endoB RNAi cells by RNAi-insensitive mutant of endophilin B1. EndoB RNAi cells were transfected with a variant of endophilin B1 bearing five silent nucleotide substitutions located within a region targeted by RNAi construct. Cells were labeled with Mitotracker (red) and stained with anti–endophilin B1 mAbs (green). (F) Phenotypes of mitochondria in cells overexpressing endoBrec construct (E, arrows) were scored (n = 680).
Figure 2.
Mitochondrial fusion rate is not affected by endophilin B1 knockdown. Mitochondrial fusion rate was assayed using the mito-PAGFP–based mitochondrial fusion assay. (A) GFP RNAi cells (a) and endoB RNAi cells (b) were transfected with mito-PAGFP and assayed for mitochondrial fusion as described in Materials and methods. Pseudocolored images are used. (B) Changes in the fluorescence intensities of photoactivated mitochondria in GFP RNAi (a) and endoB RNAi (b) were measured over time.
Figure 3.
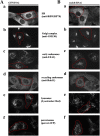
EndoB RNAi does not affect the morphology of membrane-bound organelles other than mitochondria. Morphology of ER (Aa and Ba), Golgi complex (Ab and Bb), early endosomes (Ac and Bc), recycling endosomes (Ad and Bd), lysosomes (Ae and Be), and peroxisomes (Af and Bf) in GFP RNAi (A) and endoB RNAi cells (B) was analyzed by confocal microscopy. Representative images are shown.
Figure 4.
Dissociation of OMM and IMM compartments in endophilin B1–depleted cells. GFP RNAi (A and C) and endoB RNAi (B and D) cells were labeled with Mitotracker (A, a'–f'; and B, a'–t') or transfected with mito-DsRED2 (C, a'–f'; and D, a'–j') to reveal the mitochondrial matrix compartment, and stained with anti–cytochrome c mAbs (A, a–f; and B, a–t) or transfected with YFP-Fis1 (C, a–f; and D, a–j) to reveal the OMM compartment. Representative images are shown. Note the complete colocalization of matrix and OMM compartments in GFP RNAi cells and the formation of isolated OMM compartments in endoB RNAi cells (examples are indicated by arrows). In several cases, retracted matrix compartments (arrowheads) were located along, and connected by, thin tubules of OMM. (E) Drp1 in HeLa cells was depleted using pREP4-Drp1 RNAi system (see Materials and methods). Control HeLa cells or cells transfected with GFP RNAi or Drp1 RNAi that were selected with hygromycin for 4 d were analyzed by Western blot for Drp1 levels. Actin was used as a loading control. (F) Drp1 RNAi cells were stained with Mitotracker and anti–cytochrome c mAbs and analyzed by confocal microscopy. Note the high level of connectivity of mitochondria and the complete colocalization of IMM- and OMM-enveloped compartments.
Figure 5.
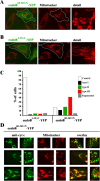
Overexpression of NH2-terminal truncated endophilin B1 induces mitochondrial morphology defects. HeLa cells were transfected with endoB60-362ΔN-YFP (A) and with endoB1-59ΔC-YFP (B) and analyzed by confocal microscopy. (C) Mitochondrial phenotypes were scored within endoB60-362ΔN-YFP– and endoB1-59ΔC-YFP–expressing cells (n = 400). (D) OMM/IMM synchrony was assayed in endoB60-362ΔN-YFP–expressing cells. Cells were labeled with Mitotracker (red), stained with anti–cytochrome c mAbs (green), and analyzed by confocal microscopy. Note apparent dissociation of OMM compartment from matrix.
Figure 6.
Dynamic association of endophilin B1 with mitochondria. HeLa cells were transfected with endoB-YFP (A, green) or stained with anti–endophilin B1 mAbs (B, green), labeled with Mitotracker to reveal mitochondria (A and B, red), and analyzed by confocal microscopy. (C) Cells were fractionated using differential centrifugation to obtain a mitochondria-enriched heavy membrane fraction (HM), a light membrane fraction (LM), and a high speed supernatant-containing soluble cytosolic proteins (HSS), and subjected to SDS PAGE and Western blot analysis to reveal the subcellular distribution of endophilin B1. Anti-Bax mAbs were used as a marker of the cytosol and anti-VDAC mAbs for mitochondria. (D) Cos7 cells transfected with pcDNA3-Bax and endoB-YFP were treated with 1 μM STS and analyzed by time-lapse confocal microscopy for the subcellular distribution of endophilin B1. Note the clustering of endoB-YFP detectable before apoptotic decomposition of the cells (c–e). To analyze the spatial relation of endoB-YFP patches and mitochondria, cells were transfected with endoB-YFP (E and F, green) or stained with anti–endophilin B1 mAbs (G, green) to reveal the subcellular distribution of endophilin B1 and labeled with Mitotracker (F and G, red) or transfected with mito-DsRED2 (E, red) to reveal mitochondria, followed by treatment with the caspase inhibitor zVAD-fmk and STS for 90 min (E) or with zVAD-fmk and ActD for 36 h (F, and G), and examined by confocal microscopy. Note the mitochondrial localization of endoB-YFP patches.
Figure 7.
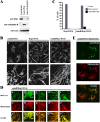
Phenotypic consequences of simultaneous down-regulation of endophilin B1 and Drp1. HeLa cells were transfected with endoB RNAi and Drp1 RNAi constructs separately or combined. Cells were selected with hygromycin for 4 d and analyzed for protein levels by Western blot (A) and, after staining with Mitotracker (B and D, a'–e') and anti–cytochrome c mAbs (D, a–e), analyzed by confocal microscopy. (C) Phenotypes of mitochondria in Drp1 RNAi and endoB/Drp1 RNAi cells were scored (n = 400). (E) EndoB RNAi cells were transfected with a DN mutant of Drp1, Drp1K38A (arrows), labeled with Mitotracker (red), stained with anti-Drp1 mAbs (green), and analyzed by confocal microscopy. Complete reversal of the endophilin B1 single RNAi phenotype and formation of Drp1-like single RNAi phenotype cells in endoB/Drp1 double RNAi cells indicates that Drp1 may be an upstream factor of endophilin B1 in the chain of events leading to mitochondrial division.
Similar articles
- Levels of human Fis1 at the mitochondrial outer membrane regulate mitochondrial morphology.
Stojanovski D, Koutsopoulos OS, Okamoto K, Ryan MT. Stojanovski D, et al. J Cell Sci. 2004 Mar 1;117(Pt 7):1201-10. doi: 10.1242/jcs.01058. J Cell Sci. 2004. PMID: 14996942 - Inhibiting Drp1-mediated mitochondrial fission selectively prevents the release of cytochrome c during apoptosis.
Estaquier J, Arnoult D. Estaquier J, et al. Cell Death Differ. 2007 Jun;14(6):1086-94. doi: 10.1038/sj.cdd.4402107. Epub 2007 Mar 2. Cell Death Differ. 2007. PMID: 17332775 - Bax/Bak promote sumoylation of DRP1 and its stable association with mitochondria during apoptotic cell death.
Wasiak S, Zunino R, McBride HM. Wasiak S, et al. J Cell Biol. 2007 May 7;177(3):439-50. doi: 10.1083/jcb.200610042. Epub 2007 Apr 30. J Cell Biol. 2007. PMID: 17470634 Free PMC article. - Shaping mitochondria: The complex posttranslational regulation of the mitochondrial fission protein DRP1.
Santel A, Frank S. Santel A, et al. IUBMB Life. 2008 Jul;60(7):448-55. doi: 10.1002/iub.71. IUBMB Life. 2008. PMID: 18465792 Review. - [Regulation of mitochondrial biogenesis and morphogenesis].
Mihara K. Mihara K. Fukuoka Igaku Zasshi. 2006 Jan;97(1):8-14. Fukuoka Igaku Zasshi. 2006. PMID: 16613214 Review. Japanese. No abstract available.
Cited by
- Suppressor of cytokine signaling 6 (SOCS6) promotes mitochondrial fission via regulating DRP1 translocation.
Lin HY, Lai RH, Lin ST, Lin RC, Wang MJ, Lin CC, Lee HC, Wang FF, Chen JY. Lin HY, et al. Cell Death Differ. 2013 Jan;20(1):139-53. doi: 10.1038/cdd.2012.106. Epub 2012 Sep 7. Cell Death Differ. 2013. PMID: 22955947 Free PMC article. - Mitochondrial dynamics and mitophagy in the 6-hydroxydopamine preclinical model of Parkinson's disease.
Galindo MF, Solesio ME, Atienzar-Aroca S, Zamora MJ, Jordán Bueso J. Galindo MF, et al. Parkinsons Dis. 2012;2012:131058. doi: 10.1155/2012/131058. Epub 2012 Aug 16. Parkinsons Dis. 2012. PMID: 22966477 Free PMC article. - Association of Endophilin B1 with Cytoplasmic Vesicles.
Li J, Barylko B, Eichorst JP, Mueller JD, Albanesi JP, Chen Y. Li J, et al. Biophys J. 2016 Aug 9;111(3):565-576. doi: 10.1016/j.bpj.2016.06.017. Biophys J. 2016. PMID: 27508440 Free PMC article. - The Bin/amphiphysin/Rvs (BAR) domain protein endophilin B2 interacts with plectin and controls perinuclear cytoskeletal architecture.
Vannier C, Pesty A, San-Roman MJ, Schmidt AA. Vannier C, et al. J Biol Chem. 2013 Sep 20;288(38):27619-27637. doi: 10.1074/jbc.M113.485482. Epub 2013 Aug 6. J Biol Chem. 2013. PMID: 23921385 Free PMC article. - Endophilin B2 promotes inner mitochondrial membrane degradation by forming heterodimers with Endophilin B1 during mitophagy.
Wang YH, Wang JQ, Wang Q, Wang Y, Guo C, Chen Q, Chai T, Tang TS. Wang YH, et al. Sci Rep. 2016 Apr 26;6:25153. doi: 10.1038/srep25153. Sci Rep. 2016. PMID: 27112121 Free PMC article.
References
- Chen, Y.A., S.J. Scales, S.M. Patel, Y.C. Doung, and R.H. Scheller. 1999. SNARE complex formation is triggered by Ca2+ and drives membrane fusion. Cell. 97:165–174. - PubMed
- Cuddeback, S.M., H. Yamaguchi, K. Komatsu, T. Miyashita, M. Yamada, C. Wu, S. Singh, and H.-G. Wang. 2001. Molecular cloning and characterization of Bif-1. A novel Src homology 3 domain-containing protein that associates with Bax. J. Biol. Chem. 276:20559–20565. - PubMed
- Degli Esposti, M., and C. Dive. 2003. Mitochondrial membrane permeabilisation by Bax/Bak. Biochem. Biophys. Res. Commun. 304:455–461. - PubMed
Publication types
MeSH terms
Substances
LinkOut - more resources
Full Text Sources
Other Literature Sources
Molecular Biology Databases
Miscellaneous


