Population genetics of polymorphism and divergence for diploid selection models with arbitrary dominance - PubMed (original) (raw)
Population genetics of polymorphism and divergence for diploid selection models with arbitrary dominance
Scott Williamson et al. Genetics. 2004 Sep.
Abstract
We develop a Poisson random-field model of polymorphism and divergence that allows arbitrary dominance relations in a diploid context. This model provides a maximum-likelihood framework for estimating both selection and dominance parameters of new mutations using information on the frequency spectrum of sequence polymorphisms. This is the first DNA sequence-based estimator of the dominance parameter. Our model also leads to a likelihood-ratio test for distinguishing nongenic from genic selection; simulations indicate that this test is quite powerful when a large number of segregating sites are available. We also use simulations to explore the bias in selection parameter estimates caused by unacknowledged dominance relations. When inference is based on the frequency spectrum of polymorphisms, genic selection estimates of the selection parameter can be very strongly biased even for minor deviations from the genic selection model. Surprisingly, however, when inference is based on polymorphism and divergence (McDonald-Kreitman) data, genic selection estimates of the selection parameter are nearly unbiased, even for completely dominant or recessive mutations. Further, we find that weak overdominant selection can increase, rather than decrease, the substitution rate relative to levels of polymorphism. This nonintuitive result has major implications for the interpretation of several popular tests of neutrality.
Figures
Figure 1.—
The stationary distribution of allele frequencies (top row) and the expected site-frequency spectrum (bottom row) for various values of the dominance parameter, h, and the selection parameter, γ. The left-hand column depicts the case of negative selection (γ = −10), and the right-hand column depicts the case of positive selection (γ = 10). The expected site-frequency spectra were generated with n = 15 and the scaled mutation parameter was set at θ = 20.
Figure 2.—
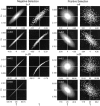
The asymptotic and simulated joint sampling distributions for maximum-likelihood estimates of the selection (γ̂) and dominance (ĥ) parameters. The white lines indicate the underlying true values. Each plot ranges ±3 asymptotic standard deviations from the true values in each axis (γ̂ and ĥ), and tick marks are drawn at ±2 asymptotic standard deviations from the means. The plots were generated with S = 10,000 and n = 25. Simulations for partially dominant, strongly deleterious mutations (γ = −20, h = 0.8) are not shown due to the computational difficulty of optimizing the likelihood function in this region of the parameter space.
Figure 3.—
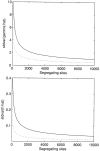
The asymptotic standard deviation of the maximum-likelihood estimates for the selection (γ̂) and dominance (ĥ) parameters as a function of the observed number of segregating sites. Solid lines represent underlying true values of γ = −10 and h = 0.2, and dotted lines represent the case of γ = 10 and h = 0.8. n = 25 for all curves.
Figure 4.—
Statistical power (fraction of tests that reject the null hypothesis) of the likelihood-ratio test to reject genic selection, shown as a function of the dominance parameter, h. Power was evaluated by simulating 1000 independent data sets for each parameter combination and then applying the likelihood-ratio test for each data set.
Figure 5.—
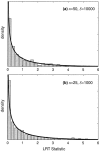
The simulated null distribution of the likelihood-ratio test statistic for nongenic selection. The null hypothesis is no dominance (h = 0.5). The solid line is the asymptotic prediction for the null distribution. Null distributions are shown for (a) weak negative selection with γ = −4 and (b) weak positive selection with γ = 4.
Figure 6.—
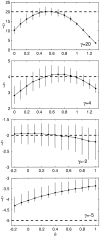
Genic selection estimates of the selection parameter, γ, obtained by simulating site-frequency spectra with varying degrees of dominance relations. Dashed lines indicate the true value of γ in the simulation; deviations from this line indicate bias. Error bars indicate 95% confidence limits on the maximum-likelihood estimate, and points marked with a star indicate that the mean maximum-likelihood estimate was >100, the maximum value allowed by our simulations. Simulations were performed with n = 25, conditional on the observed number of segregating sites at S = 10,000.
Figure 7.—
Genic selection estimates of the selection parameter, γ, obtained by simulating polymorphism and divergence data with varying degrees of dominance relations. Dashed lines indicate the true value of γ in the simulation. Note that, for γ = −5, the estimate γ̂ is biased even in the case of genic selection because we conditioned on observing at least one segregating site and one fixed difference in the sample. For each simulation, the divergence time, τ, was fixed at τ = 10, n = 25, and θ = 50. Error bars indicate the 95% confidence limits of γ̂.
Figure 8.—
The substitution rate, u(γ, h), as a function of the strength of selection, γ = 2_Ns_, for different values of the dominance parameter, h. Because the neutral substitution rate is 1, this plot also predicts the ratio of nonsynonymous to synonymous fixed differences, i.e., the _d_N/_d_S ratio.
Figure 9.—
The log-transformed ratio of the expected number of polymorphisms to the expected number of fixed differences as a function of the selection parameter, γ, for several different values of the dominance parameter, h. The ratio is plotted relative to the ratio under neutrality (_E_[_S_n]/_E_[_D_n] = 1 at γ = 0).
Similar articles
- A composite-likelihood approach for detecting directional selection from DNA sequence data.
Zhu L, Bustamante CD. Zhu L, et al. Genetics. 2005 Jul;170(3):1411-21. doi: 10.1534/genetics.104.035097. Epub 2005 May 6. Genetics. 2005. PMID: 15879513 Free PMC article. - Distinguishing between selective sweeps and demography using DNA polymorphism data.
Jensen JD, Kim Y, DuMont VB, Aquadro CF, Bustamante CD. Jensen JD, et al. Genetics. 2005 Jul;170(3):1401-10. doi: 10.1534/genetics.104.038224. Epub 2005 May 23. Genetics. 2005. PMID: 15911584 Free PMC article. - Estimating the rate of adaptive molecular evolution in the presence of slightly deleterious mutations and population size change.
Eyre-Walker A, Keightley PD. Eyre-Walker A, et al. Mol Biol Evol. 2009 Sep;26(9):2097-108. doi: 10.1093/molbev/msp119. Epub 2009 Jun 17. Mol Biol Evol. 2009. PMID: 19535738 - Joint analysis of demography and selection in population genetics: where do we stand and where could we go?
Li J, Li H, Jakobsson M, Li S, Sjödin P, Lascoux M. Li J, et al. Mol Ecol. 2012 Jan;21(1):28-44. doi: 10.1111/j.1365-294X.2011.05308.x. Epub 2011 Oct 14. Mol Ecol. 2012. PMID: 21999307 Review. - Patterns of polymorphism and divergence from noncoding sequences of Drosophila melanogaster and D. simulans: evidence for nonequilibrium processes.
Kern AD, Begun DJ. Kern AD, et al. Mol Biol Evol. 2005 Jan;22(1):51-62. doi: 10.1093/molbev/msh269. Epub 2004 Sep 29. Mol Biol Evol. 2005. PMID: 15456897 Review.
Cited by
- Revisiting Dominance in Population Genetics.
Di C, Lohmueller KE. Di C, et al. Genome Biol Evol. 2024 Aug 5;16(8):evae147. doi: 10.1093/gbe/evae147. Genome Biol Evol. 2024. PMID: 39114967 Free PMC article. Review. - SnIPRE: selection inference using a Poisson random effects model.
Eilertson KE, Booth JG, Bustamante CD. Eilertson KE, et al. PLoS Comput Biol. 2012;8(12):e1002806. doi: 10.1371/journal.pcbi.1002806. Epub 2012 Dec 6. PLoS Comput Biol. 2012. PMID: 23236270 Free PMC article. - Population genetics of polymorphism and divergence under fluctuating selection.
Huerta-Sanchez E, Durrett R, Bustamante CD. Huerta-Sanchez E, et al. Genetics. 2008 Jan;178(1):325-37. doi: 10.1534/genetics.107.073361. Epub 2007 Oct 18. Genetics. 2008. PMID: 17947441 Free PMC article. - Robust estimates of divergence times and selection with a poisson random field model: a case study of comparative phylogeographic data.
Amei A, Smith BT. Amei A, et al. Genetics. 2014 Jan;196(1):225-33. doi: 10.1534/genetics.113.157776. Epub 2013 Oct 18. Genetics. 2014. PMID: 24142896 Free PMC article. - Constraining models of dominance for nonsynonymous mutations in the human genome.
Kyriazis CC, Lohmueller KE. Kyriazis CC, et al. PLoS Genet. 2024 Sep 20;20(9):e1011198. doi: 10.1371/journal.pgen.1011198. eCollection 2024 Sep. PLoS Genet. 2024. PMID: 39302992 Free PMC article.
References
- Bustamante, C. D., R. Nielsen, S. A. Sawyer, K. M. Olsen, M. D. Purugganan et al., 2002. The cost of inbreeding: fixation of deleterious genes in Arabidopsis. Nature 416: 531–534. - PubMed
- Bustamante, C. D., R. Nielsen and D. L. Hartl, 2003. Maximum likelihood and Bayesian methods for estimating the distribution of selective effects among classes of mutations using DNA polymorphism data. Theor. Popul. Biol. 63: 91–103. - PubMed
- Charlesworth, B., and K. A. Hughes, 2000 The maintenance of genetic variation in life-history traits, pp. 369–392 in Evolutionary Genetics: From Molecules to Morphology, edited by R. S. Singh and C. B. Krimbas. Cambridge University Press, Cambridge, UK.
Publication types
MeSH terms
LinkOut - more resources
Full Text Sources


