Ethiopian mitochondrial DNA heritage: tracking gene flow across and around the gate of tears - PubMed (original) (raw)
Comparative Study
doi: 10.1086/425161. Epub 2004 Sep 27.
Affiliations
- PMID: 15457403
- PMCID: PMC1182106
- DOI: 10.1086/425161
Comparative Study
Ethiopian mitochondrial DNA heritage: tracking gene flow across and around the gate of tears
Toomas Kivisild et al. Am J Hum Genet. 2004 Nov.
Erratum in
- Am J Hum Genet. 2006 Jun;78(6):1097
Abstract
Approximately 10 miles separate the Horn of Africa from the Arabian Peninsula at Bab-el-Mandeb (the Gate of Tears). Both historic and archaeological evidence indicate tight cultural connections, over millennia, between these two regions. High-resolution phylogenetic analysis of 270 Ethiopian and 115 Yemeni mitochondrial DNAs was performed in a worldwide context, to explore gene flow across the Red and Arabian Seas. Nine distinct subclades, including three newly defined ones, were found to characterize entirely the variation of Ethiopian and Yemeni L3 lineages. Both Ethiopians and Yemenis contain an almost-equal proportion of Eurasian-specific M and N and African-specific lineages and therefore cluster together in a multidimensional scaling plot between Near Eastern and sub-Saharan African populations. Phylogeographic identification of potential founder haplotypes revealed that approximately one-half of haplogroup L0-L5 lineages in Yemenis have close or matching counterparts in southeastern Africans, compared with a minor share in Ethiopians. Newly defined clade L6, the most frequent haplogroup in Yemenis, showed no close matches among 3,000 African samples. These results highlight the complexity of Ethiopian and Yemeni genetic heritage and are consistent with the introduction of maternal lineages into the South Arabian gene pool from different source populations of East Africa. A high proportion of Ethiopian lineages, significantly more abundant in the northeast of that country, trace their western Eurasian origin in haplogroup N through assorted gene flow at different times and involving different source populations.
Figures
Figure 1
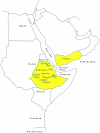
Map of East Africa and Arabia, with locations of samples collected for the present study. The five cities in Ethiopia where DNA samples were collected are indicated. The main spread zones of the five major Ethiopian linguistic groups that are discussed in the study are shown in blue capital letters.
Figure 2
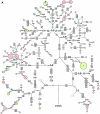
Median joining network of Ethiopian and Yemeni mtDNA haplotypes. Node sizes are proportional to haplotype frequencies, indicated within nodes for
_n_>1
. Haplotypes observed in Ethiopian and Yemeni samples are distinguished by pink and green, respectively. Variable positions (tables A1–A6 [online only]) are indicated along links that connect haplotypes. Nucleotide changes are specified only in the case of transversions. A, Network of haplogroups L0–L6. For haplotypes observed in the Yemeni population, matching HVS-I types in samples from northeastern Africa (Krings et al. ; Stevanovitch et al. 2004) and Mozambique (Pereira et al. ; Salas et al. 2002) are indicated by yellow and blue stars, respectively. B, Network of haplogroups M and N. For haplotypes observed in the Ethiopian population, matching HVS-I types in samples from northeastern Africa (Krings et al. ; Stevanovitch et al. 2004) and in the Arabian Peninsula and Iraq (Richards et al. ; Al-Zahery et al. 2003) are indicated by yellow and blue stars, respectively.
Figure 3
MDS plot of population differences. The plot is based on _F_ST distances (table A7 [online only]) calculated from haplogroup frequencies; its stress value is 0.065.
Figure 4
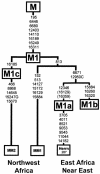
Phylogeny of mtDNA complete sequences of haplogroup M1. The tree and the character changes are reconstructed by use of maximum-parsimony criteria. Mutations are numbered relative to revised Cambridge Reference Sequence (rCRS) (Andrews 1999). Nucleotide change is specified only for transversions. Sources: MM1 and MM2 = Maca-Meyer et al. (2001); Herrn 287 = Herrnstadt et al. (2002). Haplogroups M1a and M1b are defined as in figure 2_B_ and tables A1–A6 (online only), by polymorphisms identified by Quintana-Murci (1999). Character-state changes at nps 16129 and 16359, shown in parentheses on the external branch of the Herrnstadt et al. (2002) coding-region sequence, are inferred from the complete linkage of the 12346 polymorphism with the derived status at these positions in the present study.
Similar articles
- Regional differences in the distribution of the sub-Saharan, West Eurasian, and South Asian mtDNA lineages in Yemen.
Cerný V, Mulligan CJ, Rídl J, Zaloudková M, Edens CM, Hájek M, Pereira L. Cerný V, et al. Am J Phys Anthropol. 2008 Jun;136(2):128-37. doi: 10.1002/ajpa.20784. Am J Phys Anthropol. 2008. PMID: 18257024 - Mitochondrial DNA reveals distinct evolutionary histories for Jewish populations in Yemen and Ethiopia.
Non AL, Al-Meeri A, Raaum RL, Sanchez LF, Mulligan CJ. Non AL, et al. Am J Phys Anthropol. 2011 Jan;144(1):1-10. doi: 10.1002/ajpa.21360. Am J Phys Anthropol. 2011. PMID: 20623605 - Mitochondrial DNA haplogroup H structure in North Africa.
Ennafaa H, Cabrera VM, Abu-Amero KK, González AM, Amor MB, Bouhaha R, Dzimiri N, Elgaaïed AB, Larruga JM. Ennafaa H, et al. BMC Genet. 2009 Feb 25;10:8. doi: 10.1186/1471-2156-10-8. BMC Genet. 2009. PMID: 19243582 Free PMC article. - Carriers of mitochondrial DNA macrohaplogroup L3 basal lineages migrated back to Africa from Asia around 70,000 years ago.
Cabrera VM, Marrero P, Abu-Amero KK, Larruga JM. Cabrera VM, et al. BMC Evol Biol. 2018 Jun 19;18(1):98. doi: 10.1186/s12862-018-1211-4. BMC Evol Biol. 2018. PMID: 29921229 Free PMC article. - Mitochondrial DNA structure in the Arabian Peninsula.
Abu-Amero KK, Larruga JM, Cabrera VM, González AM. Abu-Amero KK, et al. BMC Evol Biol. 2008 Feb 12;8:45. doi: 10.1186/1471-2148-8-45. BMC Evol Biol. 2008. PMID: 18269758 Free PMC article.
Cited by
- Profiling of Mitochondrial DNA Heteroplasmy in a Prospective Oral Squamous Cell Carcinoma Study.
Fendt L, Fazzini F, Weissensteiner H, Bruckmoser E, Schönherr S, Schäfer G, Losso JL, Streiter GA, Lamina C, Rasse M, Klocker H, Kofler B, Kloss-Brandstätter A, Huck CW, Kronenberg F, Laimer J. Fendt L, et al. Cancers (Basel). 2020 Jul 17;12(7):1933. doi: 10.3390/cancers12071933. Cancers (Basel). 2020. PMID: 32708892 Free PMC article. - Mitochondrial DNA diversity in two ethnic groups in southeastern Kenya: perspectives from the northeastern periphery of the Bantu expansion.
Batai K, Babrowski KB, Arroyo JP, Kusimba CM, Williams SR. Batai K, et al. Am J Phys Anthropol. 2013 Mar;150(3):482-91. doi: 10.1002/ajpa.22227. Epub 2013 Feb 5. Am J Phys Anthropol. 2013. PMID: 23382080 Free PMC article. - Evidence of the interplay of genetics and culture in Ethiopia.
López S, Tarekegn A, Band G, van Dorp L, Bird N, Morris S, Oljira T, Mekonnen E, Bekele E, Blench R, Thomas MG, Bradman N, Hellenthal G. López S, et al. Nat Commun. 2021 Jun 11;12(1):3581. doi: 10.1038/s41467-021-23712-w. Nat Commun. 2021. PMID: 34117245 Free PMC article. - Mitochondrial lineage M1 traces an early human backflow to Africa.
González AM, Larruga JM, Abu-Amero KK, Shi Y, Pestano J, Cabrera VM. González AM, et al. BMC Genomics. 2007 Jul 9;8:223. doi: 10.1186/1471-2164-8-223. BMC Genomics. 2007. PMID: 17620140 Free PMC article. - African mitochondrial haplogroup L7: a 100,000-year-old maternal human lineage discovered through reassessment and new sequencing.
Maier PA, Runfeldt G, Estes RJ, Vilar MG. Maier PA, et al. Sci Rep. 2022 Jun 24;12(1):10747. doi: 10.1038/s41598-022-13856-0. Sci Rep. 2022. PMID: 35750688 Free PMC article.
References
Electronic-Database Information
- ARLEQUIN package, http://lgb.unige.ch/arlequin/
- EMBL Nucleotide Sequence Database, http://www.ebi.ac.uk/embl/ (for the HVS-I sequences [accession numbers AJ748863–AJ749247])
References
- Al-Zahery N, Semino O, Benuzzi G, Magri C, Passarino G, Torroni A, Santachiara-Benerecetti AS (2003) Y-chromosome and mtDNA polymorphisms in Iraq, a crossroad of the early human dispersal and of post-Neolithic migrations. Mol Phylogenet Evol 28:458–472 - PubMed
- Andrews RM, Kubacka I, Chinnery PF, Lightowlers RN, Turnbull DM, Howell N (1999) Reanalysis and revision of the Cambridge reference sequence for human mitochondrial DNA. Nat Genet 23:147 - PubMed
- Bamshad M, Kivisild T, Watkins WS, Dixon ME, Ricker CE, Rao BB, Naidu JM, Prasad BV, Reddy PG, Rasanayagam A, Papiha SS, Villems R, Redd AJ, Hammer MF, Nguyen SV, Carroll ML, Batzer MA, Jorde LB (2001) Genetic evidence on the origins of Indian caste populations. Genome Res 11:994–1004 - PMC - PubMed
- Bandelt H-J, Forster P, Röhl A (1999) Median-joining networks for inferring intraspecific phylogenies. Mol Biol Evol 16:37–48 - PubMed
- Brakez Z, Bosch E, Izaabel H, Akhayat O, Comas D, Bertranpetit J, Calafell F (2001) Human mitochondrial DNA sequence variation in the Moroccan population of the Souss area. Ann Hum Biol 28:295–307 - PubMed
Publication types
MeSH terms
Substances
LinkOut - more resources
Full Text Sources


