Molecular signatures of proliferation and quiescence in hematopoietic stem cells - PubMed (original) (raw)
Molecular signatures of proliferation and quiescence in hematopoietic stem cells
Teresa A Venezia et al. PLoS Biol. 2004 Oct.
Abstract
Stem cells resident in adult tissues are principally quiescent, yet harbor enormous capacity for proliferation to achieve self renewal and to replenish their tissue constituents. Although a single hematopoietic stem cell (HSC) can generate sufficient primitive progeny to repopulate many recipients, little is known about the molecular mechanisms that maintain their potency or regulate their self renewal. Here we have examined the gene expression changes that occur over a time course when HSCs are induced to proliferate and return to quiescence in vivo. These data were compared to data representing differences between naturally proliferating fetal HSCs and their quiescent adult counterparts. Bioinformatic strategies were used to group time-ordered gene expression profiles generated from microarrays into signatures of quiescent and dividing stem cells. A novel method for calculating statistically significant enrichments in Gene Ontology groupings for our gene lists revealed elemental subgroups within the signatures that underlie HSC behavior, and allowed us to build a molecular model of the HSC activation cycle. Initially, quiescent HSCs evince a state of readiness. The proliferative signal induces a preparative state, which is followed by active proliferation divisible into early and late phases. Re-induction of quiescence involves changes in migratory molecule expression, prior to reestablishment of homeostasis. We also identified two genes that increase in both gene and protein expression during activation, and potentially represent new markers for proliferating stem cells. These data will be of use in attempts to recapitulate the HSC self renewal process for therapeutic expansion of stem cells, and our model may correlate with acquisition of self renewal characteristics by cancer stem cells.
Conflict of interest statement
The authors have declared that no conflicts of interest exist.
Figures
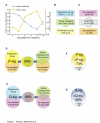
Figure 1. P-Sig and Q-Sig Defined by Gene Expression Levels in HSCs in Different Stages of Cell Cycle
(A) Graphic depicting the changes in bone marrow cellularity and number of HSCs in cell cycle following 5FU treatment (adapted from Harrison and Lerner 1991; Randall and Weissman 1997). (B) Schematic of 5FU-HSC time course analysis. The genes that change over the time course can be split into two groups based on the day of maximum expression (TOM). (C) Schematic of pair-wise comparison between quiescent adult HSCs and FL-HSCs, showing groups of genes either up-regulated in the quiescent adult cells or up-regulated in the cycling FL-HSCs. (D) Genes that were both up-regulated in FL-HSCs and were in the proliferation group composed the P-sig. The P-sig shows 94% overlap with the group of genes that were up-regulated in FL-HSCs and changed over the time course. (E) Genes that were both in the quiescence group and up-regulated in adult HSCs were termed the Q-sig. The Q-sig overlaps 96% with the set of genes that were up-regulated in adult HSCs and changed over the time course. (F) Overlap of the ST-HSC signature with P-sig revealed 73% in common, defining the common P-sig. (G) Overlap of the LT-HSC signature with Q-sig revealed 58% in common and defined the common Q-sig. This figure is interactive online, and provides contextual access to Tables S1–S11. Use your mouse to highight animated areas of the graphic. Click on these areas to link to related files.
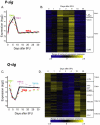
Figure 2. P-Sig and Q-Sig Show Patterns of Activation and Down-Regulation with Respect to Cell Cycle Status
(A) Averaged pattern of P-sig gene expression over the 5FU time course plotted in solid lines, with the contributing TOM subgroups plotted in dashed lines. (B) Heat map of each gene in P-sig over the 5FU time course showing TOM subgroups in brackets. (C) Averaged pattern of Q-sig gene expression over the 5FU time course plotted in solid lines, with the contributing TOM subgroups plotted in dashed lines. (D) Heat map of each gene in Q-sig over the 5FU time course showing TOM subgroups in brackets. For both heat maps, relative expression levels are displayed according to color intensity, blue (lowest) to yellow (highest). This figure is interactive online, and provides contextual access to Tables S12–S18. Use your mouse to highight animated areas of the graphic. Click on these areas to link to related files.
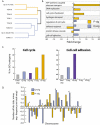
Figure 3. GO Analysis and Chromosomal Clustering
(A) Dendrogram of gene lists clustered solely according to their similarity in GO content. (B) Bar graph showing enrichments of selected GO groups in the Q-sig and P-sig. Fold changes are relative to whole microarray (p < 0.05). Asterisk marks groups in which no genes were found (complete depletion). (C) Percentage of genes within each list that are in the GO groups “cell cycle” or “cell–cell adhesion.” (D) Distribution of hits within Q-sig and P-sig on each chromosome normalized for number of expected hits for whole microarray. Pound sign denotes significant differences between Q-sig and P-sig (p < 0.05). This figure is interactive online, and provides contextual access to Tables S19–S45. Use your mouse to highight animated areas of the graphic. Click on these areas to link to related files.
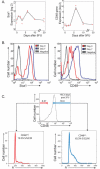
Figure 4. Gene Expression Profiles Correlate with Protein Expression on HSCs
(A) Gene expression over time. The actual observed values of each replicate at each time point are shown in red, and the line connects the predicted expression value at each time point based on our regression analysis. (B) Antigen expression on HSCs measured by flow cytometry. Gray lines represent negative control, red lines represent protein expression at day 0, and blue lines represent protein expression at day 7. (C) Cell cycle analysis of CD48− and CD48+ HSCs isolated 6 d post 5FU treatment.
Figure 5. Model of HSC Activation Cycle
(A) Normal HSCs reside in a quiescent niche in a “state of readiness” exemplified by the indicated genes. (B) Upon stress (5FU treatment), HSCs “pause” by remaining quiescent and in their niche while they “prepare” to proliferate. HSCs receive signals from proinflammatory cytokines at this point. The signals induce a proliferative state that is divisible into early (C) and late (D) phases. (C) “Early proliferation” is marked by an increase in expression of genes involved in DNA replication, repair, and cell migration molecules that allow movement of HSCs from the quiescence niche to the proliferative zone. (D) “Late proliferation” is marked by expression of many cell cycle genes as well as many energy pathway molecules. (E) Re-induction of quiescence involves changes in migratory molecule expression, which leads to return of cells to their quiescence niche, as well the expression of antiproliferative genes.
Similar articles
- Mechanisms of self-renewal in hematopoietic stem cells.
Wang Z, Ema H. Wang Z, et al. Int J Hematol. 2016 May;103(5):498-509. doi: 10.1007/s12185-015-1919-5. Epub 2015 Dec 12. Int J Hematol. 2016. PMID: 26662558 Review. - Slicer Endonuclease Argonaute 2 Is a Negative Regulator of Hematopoietic Stem Cell Quiescence.
Lu K, Nakagawa MM, Thummar K, Rathinam CV. Lu K, et al. Stem Cells. 2016 May;34(5):1343-53. doi: 10.1002/stem.2302. Epub 2016 Mar 28. Stem Cells. 2016. PMID: 26850790 - CD81 is essential for the re-entry of hematopoietic stem cells to quiescence following stress-induced proliferation via deactivation of the Akt pathway.
Lin KK, Rossi L, Boles NC, Hall BE, George TC, Goodell MA. Lin KK, et al. PLoS Biol. 2011 Sep;9(9):e1001148. doi: 10.1371/journal.pbio.1001148. Epub 2011 Sep 13. PLoS Biol. 2011. PMID: 21931533 Free PMC article. - Molecular integration of HoxB4 and STAT3 for self-renewal of hematopoietic stem cells: a model of molecular convergence for stemness.
Hong SH, Yang SJ, Kim TM, Shim JS, Lee HS, Lee GY, Park BB, Nam SW, Ryoo ZY, Oh IH. Hong SH, et al. Stem Cells. 2014 May;32(5):1313-22. doi: 10.1002/stem.1631. Stem Cells. 2014. PMID: 24446131 - Protection of hematopoietic stem cells from stress-induced exhaustion and aging.
Singh S, Jakubison B, Keller JR. Singh S, et al. Curr Opin Hematol. 2020 Jul;27(4):225-231. doi: 10.1097/MOH.0000000000000586. Curr Opin Hematol. 2020. PMID: 32398455 Review.
Cited by
- Characterization of stem cell landscape and assessing the stemness degree to aid clinical therapeutics in hematologic malignancies.
Feng YD, Du J, Chen HL, Shen Y, Jia YC, Zhang PY, He A, Yang Y. Feng YD, et al. Sci Rep. 2024 Oct 10;14(1):23743. doi: 10.1038/s41598-024-74806-6. Sci Rep. 2024. PMID: 39390242 Free PMC article. - Aging is associated with functional and molecular changes in distinct hematopoietic stem cell subsets.
Su TY, Hauenstein J, Somuncular E, Dumral Ö, Leonard E, Gustafsson C, Tzortzis E, Forlani A, Johansson AS, Qian H, Månsson R, Luc S. Su TY, et al. Nat Commun. 2024 Sep 11;15(1):7966. doi: 10.1038/s41467-024-52318-1. Nat Commun. 2024. PMID: 39261515 Free PMC article. - Kinase-inactivated CDK6 preserves the long-term functionality of adult hematopoietic stem cells.
Mayer IM, Doma E, Klampfl T, Prchal-Murphy M, Kollmann S, Schirripa A, Scheiblecker L, Zojer M, Kunowska N, Gebrail L, Shaw LE, Mann U, Farr A, Grausenburger R, Heller G, Zebedin-Brandl E, Farlik M, Malumbres M, Sexl V, Kollmann K. Mayer IM, et al. Blood. 2024 Jul 11;144(2):156-170. doi: 10.1182/blood.2023021985. Blood. 2024. PMID: 38684032 Free PMC article. - Caloric restriction leads to druggable LSD1-dependent cancer stem cells expansion.
Pallavi R, Gatti E, Durfort T, Stendardo M, Ravasio R, Leonardi T, Falvo P, Duso BA, Punzi S, Xieraili A, Polazzi A, Verrelli D, Trastulli D, Ronzoni S, Frascolla S, Perticari G, Elgendy M, Varasi M, Colombo E, Giorgio M, Lanfrancone L, Minucci S, Mazzarella L, Pelicci PG. Pallavi R, et al. Nat Commun. 2024 Jan 27;15(1):828. doi: 10.1038/s41467-023-44348-y. Nat Commun. 2024. PMID: 38280853 Free PMC article. - Stem cell-like reprogramming is required for leukemia-initiating activity in B-ALL.
Fregona V, Bayet M, Bouttier M, Largeaud L, Hamelle C, Jamrog LA, Prade N, Lagarde S, Hebrard S, Luquet I, Mansat-De Mas V, Nolla M, Pasquet M, Didier C, Khamlichi AA, Broccardo C, Delabesse É, Mancini SJC, Gerby B. Fregona V, et al. J Exp Med. 2024 Jan 1;221(1):e20230279. doi: 10.1084/jem.20230279. Epub 2023 Nov 6. J Exp Med. 2024. PMID: 37930337 Free PMC article.
References
- Akashi K, He X, Chen J, Iwasaki H, Niu C, et al. Transcriptional accessibility for genes of multiple tissues and hematopoietic lineages is hierarchically controlled during early hematopoiesis. Blood. 2003;101:383–389. - PubMed
- Bhunia AK, Piontek K, Boletta A, Liu L, Qian F, et al. PKD1 induces p21(waf1) and regulation of the cell cycle via direct activation of the JAK-STAT signaling pathway in a process requiring PKD2. Cell. 2002;109:157–168. - PubMed
- Bradford GB, Williams B, Rossi R, Bertoncello I. Quiescence, cycling, and turnover in the primitive hematopoietic stem cell compartment. Exp Hematol. 1997;25:445–453. - PubMed
- Calvi LM, Adams GB, Weibrecht KW, Weber JM, Olson DP, et al. Osteoblastic cells regulate the haematopoietic stem cell niche. Nature. 2003;425:841–846. - PubMed
Publication types
MeSH terms
Substances
Grants and funding
- DK63588/DK/NIDDK NIH HHS/United States
- R01 CA081179/CA/NCI NIH HHS/United States
- U01 DK063588/DK/NIDDK NIH HHS/United States
- CA81179/CA/NCI NIH HHS/United States
- R55 CA081179/CA/NCI NIH HHS/United States
LinkOut - more resources
Full Text Sources
Other Literature Sources
Medical


