Massive CA1/2 neuronal loss with intraneuronal and N-terminal truncated Abeta42 accumulation in a novel Alzheimer transgenic model - PubMed (original) (raw)
Comparative Study
. 2004 Oct;165(4):1289-300.
doi: 10.1016/s0002-9440(10)63388-3.
Nicolas Sergeant, Jean-Michel Itier, Véronique Blanchard, Oliver Wirths, Nicolien van der Kolk, Valérie Vingtdeux, Evita van de Steeg, Gwenaëlle Ret, Thierry Canton, Hervé Drobecq, Allan Clark, Bruno Bonici, André Delacourte, Jesús Benavides, Christoph Schmitz, Günter Tremp, Thomas A Bayer, Patrick Benoit, Laurent Pradier
Affiliations
- PMID: 15466394
- PMCID: PMC1618627
- DOI: 10.1016/s0002-9440(10)63388-3
Comparative Study
Massive CA1/2 neuronal loss with intraneuronal and N-terminal truncated Abeta42 accumulation in a novel Alzheimer transgenic model
Caty Casas et al. Am J Pathol. 2004 Oct.
Abstract
Alzheimer's disease (AD) is characterized by a substantial degeneration of pyramidal neurons and the appearance of neuritic plaques and neurofibrillary tangles. Here we present a novel transgenic mouse model, APP(SL)PS1KI that closely mimics the development of AD-related neuropathological features including a significant hippocampal neuronal loss. This transgenic mouse model carries M233T/L235P knocked-in mutations in presenilin-1 and overexpresses mutated human beta-amyloid (Abeta) precursor protein. Abeta(x-42) is the major form of Abeta species present in this model with progressive development of a complex pattern of N-truncated variants and dimers, similar to those observed in AD brain. At 10 months of age, an extensive neuronal loss (>50%) is present in the CA1/2 hippocampal pyramidal cell layer that correlates with strong accumulation of intraneuronal Abeta and thioflavine-S-positive intracellular material but not with extracellular Abeta deposits. A strong reactive astrogliosis develops together with the neuronal loss. This loss is already detectable at 6 months of age and is PS1KI gene dosage-dependent. Thus, APP(SL)PS1KI mice further confirm the critical role of intraneuronal Abeta(42) in neuronal loss and provide an excellent tool to investigate therapeutic strategies designed to prevent AD neurodegeneration.
Figures
Figure 1-4263
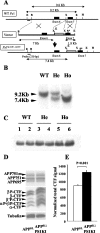
Gene-targeting strategy for PS1KI mouse generation and effect of _Ps_1 mutations on PS1 expression and APP metabolism in the mouse brain. A: Schematic representation of the structure and restriction map of the wild-type mouse _Ps_1 gene (WT _Ps_1) around the exon (black box) 7 (top line) and the targeting vector used (immediately below line, vector) with the neo-cassette (gray box). Base pair changes were performed by directed mutagenesis to create M233T and L235P mutations (**) in the exon 7. The modified locus containing the point mutations in _Ps_1 gene is illustrated in the bottom line (_Ps_1M233T, L235T). The position of a 230-bp DNA fragment used as a probe for ES cells and mice screening is indicated. Sizes of DNA fragments generated by enzymatic digestion are also indicated. Restriction enzymes: E, _Eco_RI; X, _Xba_I; B, _Bam_HII; H, _Hind_III. B: Southern blot hybridization to discriminate among the WT (single 9.2-kb band), homozygous (Ho, single 7.4-kb band), and heterozygous (He, both bands) mice. C: Western blot of 20-kd C-terminal PS1 protein showing normal levels in mutant mice. D: Analysis of APP holoprotein and APP-CTFs in APPSLPS1KI mice by Western blot on 6-month-old mouse brain. Detection was performed with APP-CTF C17 antiserum. The three bands detected for the full-length APP correspond to the murine APP695 and the immature and mature human APP751 isoforms that are not modified. In middle panel, arrows indicate the α-, β-, β′- and αP-, β′P-, βP-APP-CTFs that are increased in the PS1KI. E: Quantification of the Western blot in D was done after signal normalization with tubulin and the value means ± SEM (n = 4 mice for each group) obtained for the APPSL (in white) and APPSLPS1KI mice (in black) are represented as histograms. Statistical significance was analyzed with the Student’s _t_-test.
Figure 2-4263
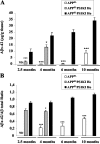
Accelerated Aβ accumulation in APPSLPS1KI mouse brain. Whole brain (minus cerebellum) Aβ42 levels (A) or Aβ42/total Aβ ratio (B) were quantified by electrochemiluminescence (average ± SEM) in APPSL and APPSLPS1KI homozygous (Ho) or heterozygous (He) for _Ps_1M233T/L235P. Asterisks indicate the significance of the difference whether none, one, or two copies of the mutated PS1 allele are present (*, P < 0.05; ***, P < 0.005; Mann-Whitney test, n = 5 to 7). Note: 6- and 10-month-old hemizygous APPSLPS1KI animals were not investigated.
Figure 3-4263
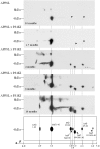
Proteomic analysis of Aβ42 species in the APPSL and APPSLPS1KI transgenic mice. Two-dimensional Western blots of Aβ42 species were performed from acid formic-solubilized brain homogenates from APPSL (top) and APPSLPS1KI (remaining panels) transgenic mice at the indicated ages. Two APPSL, one APPSLPS1KI at 2.5 and 4 months of age, and two at 6 and 10 months of age were analyzed. According to the characterization of Aβ42 species performed in the human brain of patients with AD and confirmed by mass spectrometry analysis (see supplemental Figure S1), the identity of human Aβ42 species (hAβ) is summarized at the bottom. Isoelectric points were determined using internal standards. Spot at pI 4.3 putatively corresponds to the endogenous mouse Aβ42 (mAb). Arrowheads point (down leftwards) to the weak staining of spots at pI 5.8 and 6.3. Monomeric species of Aβ42 are visualized at 4 kd, whereas dimeric species are resolved at 8 kd.
Figure 4-4263
Accelerated Aβ peptide deposition in APPSLPS1KI mouse brain. Representative photomicrographs of Aβ immunostaining on sagittal brain sections taken from 6 (A)- and 10 (B)-month-old APPSL (left) and APPSLPS1KI mice (right) (4G8 antibody on 25-μm-thick cryostat sections). Aβ immunostaining in the entire section and in the cortical (Cx), subicular, hippocampal (Hip), and thalamic (Tha) subareas illustrate the acceleration of extracellular Aβ deposition and its widespread distribution in brain parenchyma of young (ie, 6 months of age) APPSLPS1KI mice (higher magnification in bottom panels). Note the difference in the size and number of Aβ deposits in double- versus single-transgenic mice at 10 months of age with overall similar amyloid load (B). Scale bars: 500 μm, top panel (A); 20 μm, middle panel (A); 20 μm, bottom panel (B).
Figure 5-4263
APPSLPS1KI transgenic mice develop massive neuronal loss in the hippocampus. A: Representative photomicrographs of cresyl violet-stained sagittal brain sections of 10-month-old PS1KI, APPSL, and two APPSLPS1KI mice at low magnification. Note the deeply reduced thickness of the CA1/2 pyramidal cell layer indicated between arrows in the APPSLPS1KI brain (bottom). B: Higher magnification views of the cresyl violet-stained CA1/2 subfield of a representative APPSL (top) and APPSLPS1KI (bottom) mouse are shown. C: APP immunostaining of the hippocampal formation in 2 (top)- and 10 (bottom)-month-old APPSLPS1KI mice. APP staining reveals a very strong APP expression in CA1/2 subfield with a faint labeling in CA3 where no neuronal loss was detected. Note again the reduced thickness of CA1/2 subfield with the APP neuronal immunostaining. Scale bars: 150 μm (A); 50 μm (B); 100 μm (C).
Figure 6-4263
Stereological examination of total numbers of neurons within CA1/2 hippocampal cell layer. APPSL, PS1KI, and APPSLPS1KI transgenic were analyzed by high precision design-based stereological assessment (see Material and Methods). M2, 2-month-old animals (PS1KI, four males; APPSL, two males and one female; APPSLPS1KI, two males and two females). M10, 10-month-old animals (PS1KI, four males; APPSL, three males and one female; APPSLPS1KI, two males and two females). Differences between the groups were tested with analysis of variance followed by posthoc Bonferoni’s multiple comparison test for pair-wise comparisons. Statistical significance was established at P < 0.05. **, P < 0.01; ***, P < 0.001.
Figure 7-4263
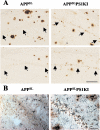
Relationship between neuronal loss and intraneuronal Aβ peptide accumulation in the CA1/2 subfield. Representative photomicrographs of Aβ immunostaining (4G8 antibody) on sagittal brain sections of 10-month-old APPSL (left) and APPSLPS1KI (right) mice. Two different mice per group are illustrated. A: Within the CA1/2 hippocampal subarea Aβ deposits are mainly present on either side of rather than within the pyramidal cell layer in both APPSL and APPSLPS1KI. Both the intensity and frequency of granular Aβ immunostaining within the remaining CA1/2 pyramidal cells were increased in APPSLPS1KI mice compared to APPSL mice. Arrows indicate the localization of the CA1/2 neuronal cell layer. B: Astrocytic staining against GFAP (blue) and Aβ staining (antiserum 692, brown) in CA1 of a 6-month-old APPSL (left) and APPSLPS1KI (right) 4-μm brain sections. Note the astrogliosis in the pyramidal cell layer in APPSLPS1KI mice. Scale bars: 100 μm (A); 50 μm (B).
Figure 8-4263
Intraneuronal Aβ peptide accumulation in CA1/2. Representative photomicrographs of Aβ immunoreactivity in 2 (A)-, 6 (B)-, and 10 (C)-month-old APPSLPS1KI mice (antibody 692). Whereas young mice show a punctate staining pattern, larger and compact granules were evident in aged mice. B: Note the reduced thickness of the CA1/2 pyramidal layer already at 6 months. D and E: Thioflavine-S staining reveals aggregated intracellular material in 2 (D)- and 10 (E)-month-old APPSLPS1KI mice. F: High-power photomicrograph demonstrating abundant intraneuronal Aβ in the CA1 subfield of a 2-month-old APPSLPS1KI mouse. G: Double labeling of Aβ (blue) and APP (brown) in a 2-month-old APPSLPS1KI mouse, showing abundant intraneuronal Aβ in cortical APP-expressing neurons. H and I: High-power photomicrographs of the subiculum of a 2-month-old APPSLPS1KI mouse showing abundant intraneuronal Aβ40 (H) as well as Aβ42 (I). The thickness of the sections was 4 μm in all pictures. Counter staining was performed with hematoxylin (A-C, F, H, I) and 4′,6-diamidine-2′-phenylindole dihydrochloride (D, E). Scale bars: 50 μm (A–E); 2 μm (F–I). Original magnifications: ×400 (D, E); ×1000 (insets in D, E).
Similar articles
- Abundance of Aβ₅-x like immunoreactivity in transgenic 5XFAD, APP/PS1KI and 3xTG mice, sporadic and familial Alzheimer's disease.
Guzmán EA, Bouter Y, Richard BC, Lannfelt L, Ingelsson M, Paetau A, Verkkoniemi-Ahola A, Wirths O, Bayer TA. Guzmán EA, et al. Mol Neurodegener. 2014 Apr 2;9:13. doi: 10.1186/1750-1326-9-13. Mol Neurodegener. 2014. PMID: 24694184 Free PMC article. - Pyroglutamate Abeta pathology in APP/PS1KI mice, sporadic and familial Alzheimer's disease cases.
Wirths O, Bethge T, Marcello A, Harmeier A, Jawhar S, Lucassen PJ, Multhaup G, Brody DL, Esparza T, Ingelsson M, Kalimo H, Lannfelt L, Bayer TA. Wirths O, et al. J Neural Transm (Vienna). 2010 Jan;117(1):85-96. doi: 10.1007/s00702-009-0314-x. Epub 2009 Oct 13. J Neural Transm (Vienna). 2010. PMID: 19823761 Free PMC article. - Gene Expression Profiling in the APP/PS1KI Mouse Model of Familial Alzheimer's Disease.
Weissmann R, Hüttenrauch M, Kacprowski T, Bouter Y, Pradier L, Bayer TA, Kuss AW, Wirths O. Weissmann R, et al. J Alzheimers Dis. 2016;50(2):397-409. doi: 10.3233/JAD-150745. J Alzheimers Dis. 2016. PMID: 26639971 - Alzheimer's disease.
De-Paula VJ, Radanovic M, Diniz BS, Forlenza OV. De-Paula VJ, et al. Subcell Biochem. 2012;65:329-52. doi: 10.1007/978-94-007-5416-4_14. Subcell Biochem. 2012. PMID: 23225010 Review. - [The beta-amyloid cascade hypothesis: a sequence of events leading to neurodegeneration in Alzheimer's disease].
Kowalska A. Kowalska A. Neurol Neurochir Pol. 2004 Sep-Oct;38(5):405-11. Neurol Neurochir Pol. 2004. PMID: 15565529 Review. Polish.
Cited by
- Linking Social Cognition, Parvalbumin Interneurons, and Oxytocin in Alzheimer's Disease: An Update.
Černotová D, Hrůzová K, Levčík D, Svoboda J, Stuchlík A. Černotová D, et al. J Alzheimers Dis. 2023;96(3):861-875. doi: 10.3233/JAD-230333. J Alzheimers Dis. 2023. PMID: 37980658 Free PMC article. Review. - The place of choline acetyltransferase activity measurement in the "cholinergic hypothesis" of neurodegenerative diseases.
Contestabile A, Ciani E, Contestabile A. Contestabile A, et al. Neurochem Res. 2008 Feb;33(2):318-27. doi: 10.1007/s11064-007-9497-4. Epub 2007 Oct 17. Neurochem Res. 2008. PMID: 17940885 Review. - The Amyloid Cascade Hypothesis 2.0 for Alzheimer's Disease and Aging-Associated Cognitive Decline: From Molecular Basis to Effective Therapy.
Volloch V, Rits-Volloch S. Volloch V, et al. Int J Mol Sci. 2023 Jul 31;24(15):12246. doi: 10.3390/ijms241512246. Int J Mol Sci. 2023. PMID: 37569624 Free PMC article. - Insights into Alzheimer disease pathogenesis from studies in transgenic animal models.
Schaeffer EL, Figueiro M, Gattaz WF. Schaeffer EL, et al. Clinics (Sao Paulo). 2011;66 Suppl 1(Suppl 1):45-54. doi: 10.1590/s1807-59322011001300006. Clinics (Sao Paulo). 2011. PMID: 21779722 Free PMC article. Review.
References
- West MJ, Coleman PD, Flood DG, Troncoso JC. Differences in the pattern of hippocampal neuronal loss in normal ageing and Alzheimer’s disease. Lancet. 1994;344:769–772. - PubMed
- Morrison JH, Hof PR. Life and death of neurons in the aging brain. Science. 1997;278:412–419. - PubMed
- Wolfe MS. The secretases of Alzheimer’s disease. Curr Top Dev Biol. 2003;54:233–261. - PubMed
- Francis R, McGrath G, Zhang J, Ruddy DA, Sym M, Apfeld J, Nicoll M, Maxwell M, Hai B, Ellis MC, Parks AL, Xu W, Li J, Gurney M, Myers RL, Himes CS, Hiebsch R, Ruble C, Nye JS, Curtis D. Aph-1 and pen-2 are required for Notch pathway signaling, gamma-secretase cleavage of betaAPP, and presenilin protein accumulation. Dev Cell. 2002;3:85–97. - PubMed
Publication types
MeSH terms
Substances
LinkOut - more resources
Full Text Sources
Other Literature Sources
Medical
Molecular Biology Databases
Miscellaneous


